Data Factory Pipelines in Microsoft Fabric
EExplore the power of data pipelines in Microsoft Fabric. Learn how these pipelines streamline data transfer and transformation, using activities, parameters, and runs for efficient data management. Discover a code-minimal approach to handling data with flexibility and ease.

Data Factory Pipelines in Microsoft Fabric
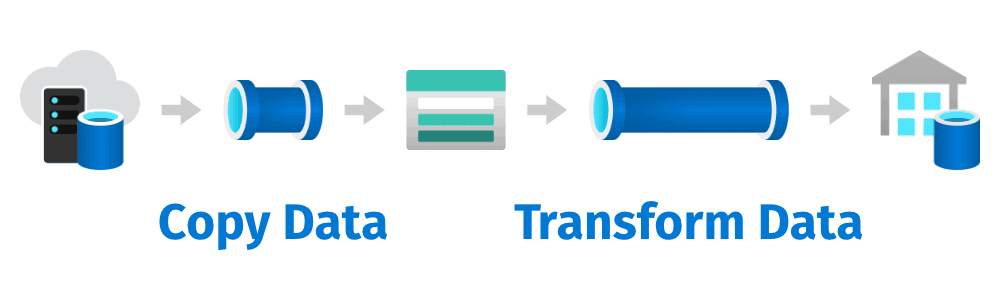
Data pipelines are essential tools that automate the process of transferring and transforming data. They extract data from various sources and load it into analytical stores like lakehouses or data warehouses, often modifying the data along the way. For those familiar with Azure Data Factory, Microsoft Fabric’s data pipelines will seem familiar. They use a similar structure of linked activities for diverse data processing tasks and logic control. These pipelines can be operated interactively through Microsoft Fabric’s interface or set to run automatically.
Understanding Pipelines in Microsoft Fabric
Microsoft Fabric offers a powerful tool for data movement and processing tasks: pipelines. These pipelines allow you to define and orchestrate a series of activities, from data transfer to complex transformations, all with minimal coding required. Here’s a quick overview of the key concepts:
-
Activities: These are the core of your pipeline, representing the tasks executed. There are two main types:
- Data Transformation Activities: These include operations like data extraction, loading, and more advanced data flow transformations.
- Control Flow Activities: These help in implementing logic like loops, conditional branching, and managing variables.
-
Parameters: Pipelines can be customized with parameters, enhancing their flexibility and reusability. Parameters allow you to specify certain values each time the pipeline runs, like choosing a folder for data storage.
-
Pipeline Runs: Every execution of a pipeline results in a pipeline run. These runs can be scheduled or initiated on-demand, with each having a unique ID for tracking and reviewing purposes.
In essence, Microsoft Fabric’s pipelines provide a streamlined, code-minimal approach to managing and transforming data, adaptable to various needs through parameters and controlled via user-friendly activities.
Hands-on
Step-by-Step Guide
1. Creating a Workspace
- Go to the Microsoft Fabric home page and select “Synapse Data Engineering.”
- In the left menu, click on “Workspaces” (icon resembling 🗇).
- Create a new workspace, choosing a licensing mode with Fabric capacity (Trial, Premium, or Fabric).
2. Creating a Lakehouse
- In your workspace, create a new Lakehouse.
- Initially, this lakehouse will have no Tables or Files.
3. Preparing the Lakehouse
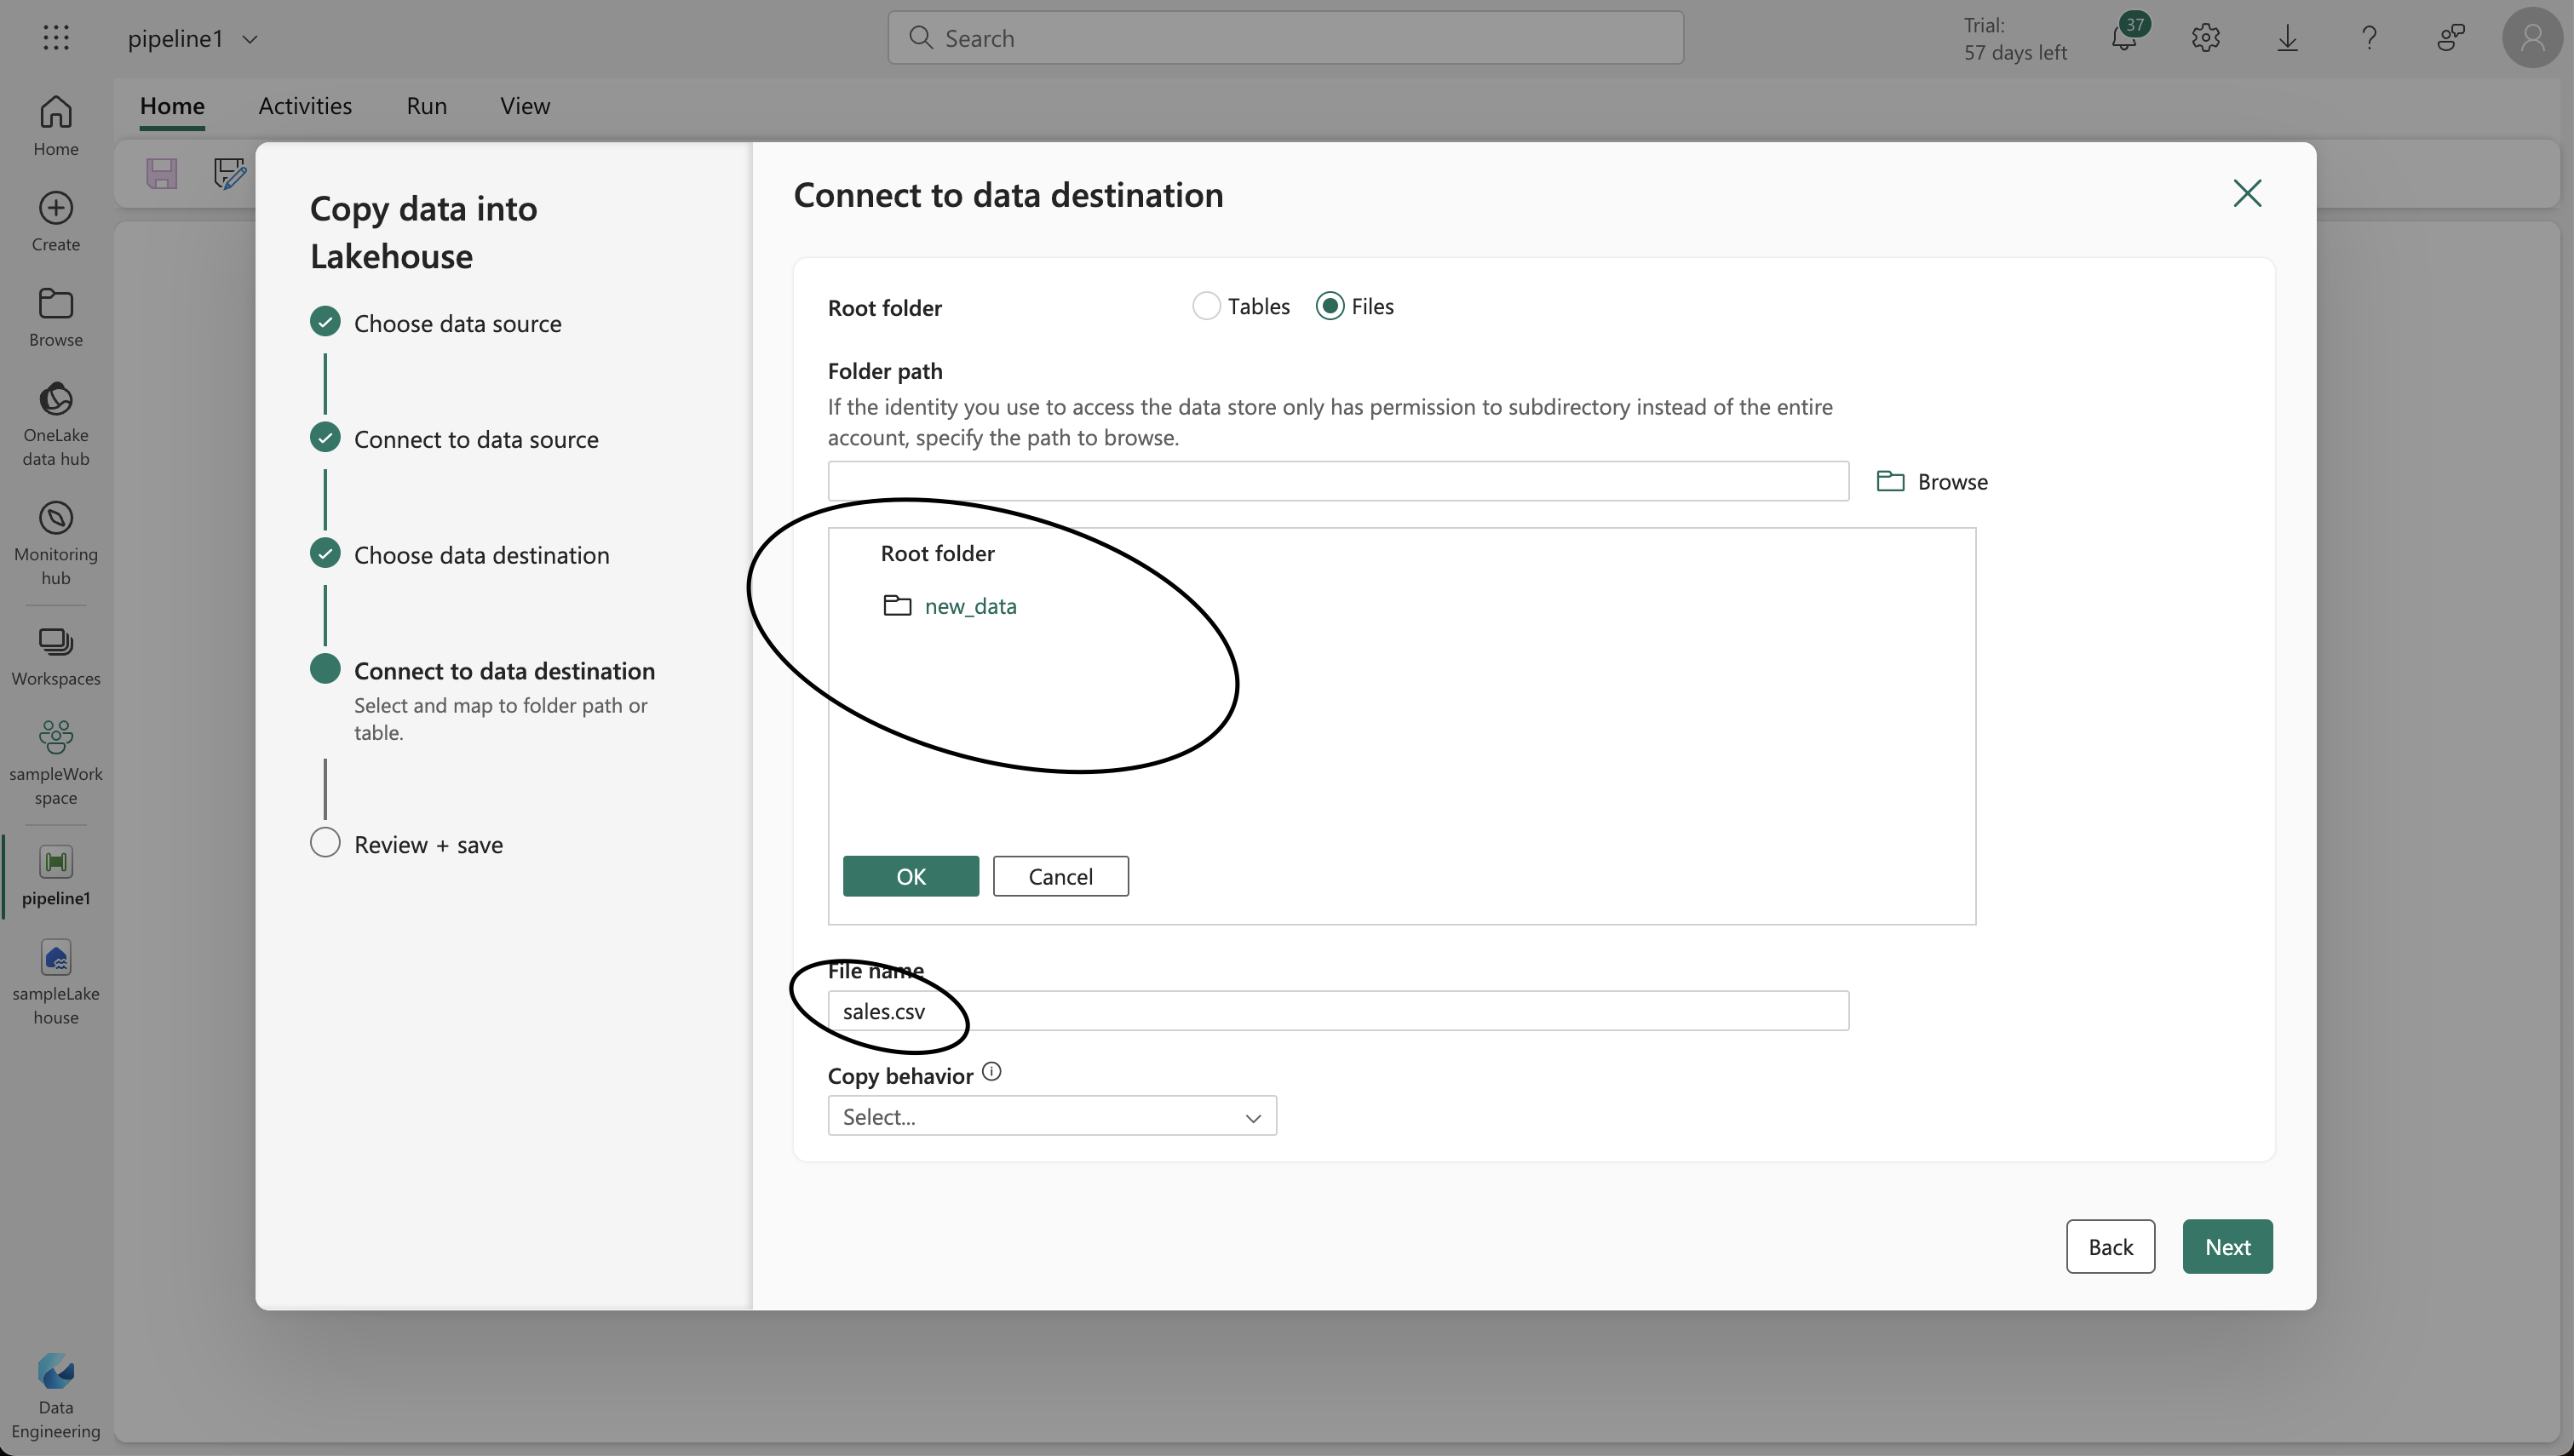
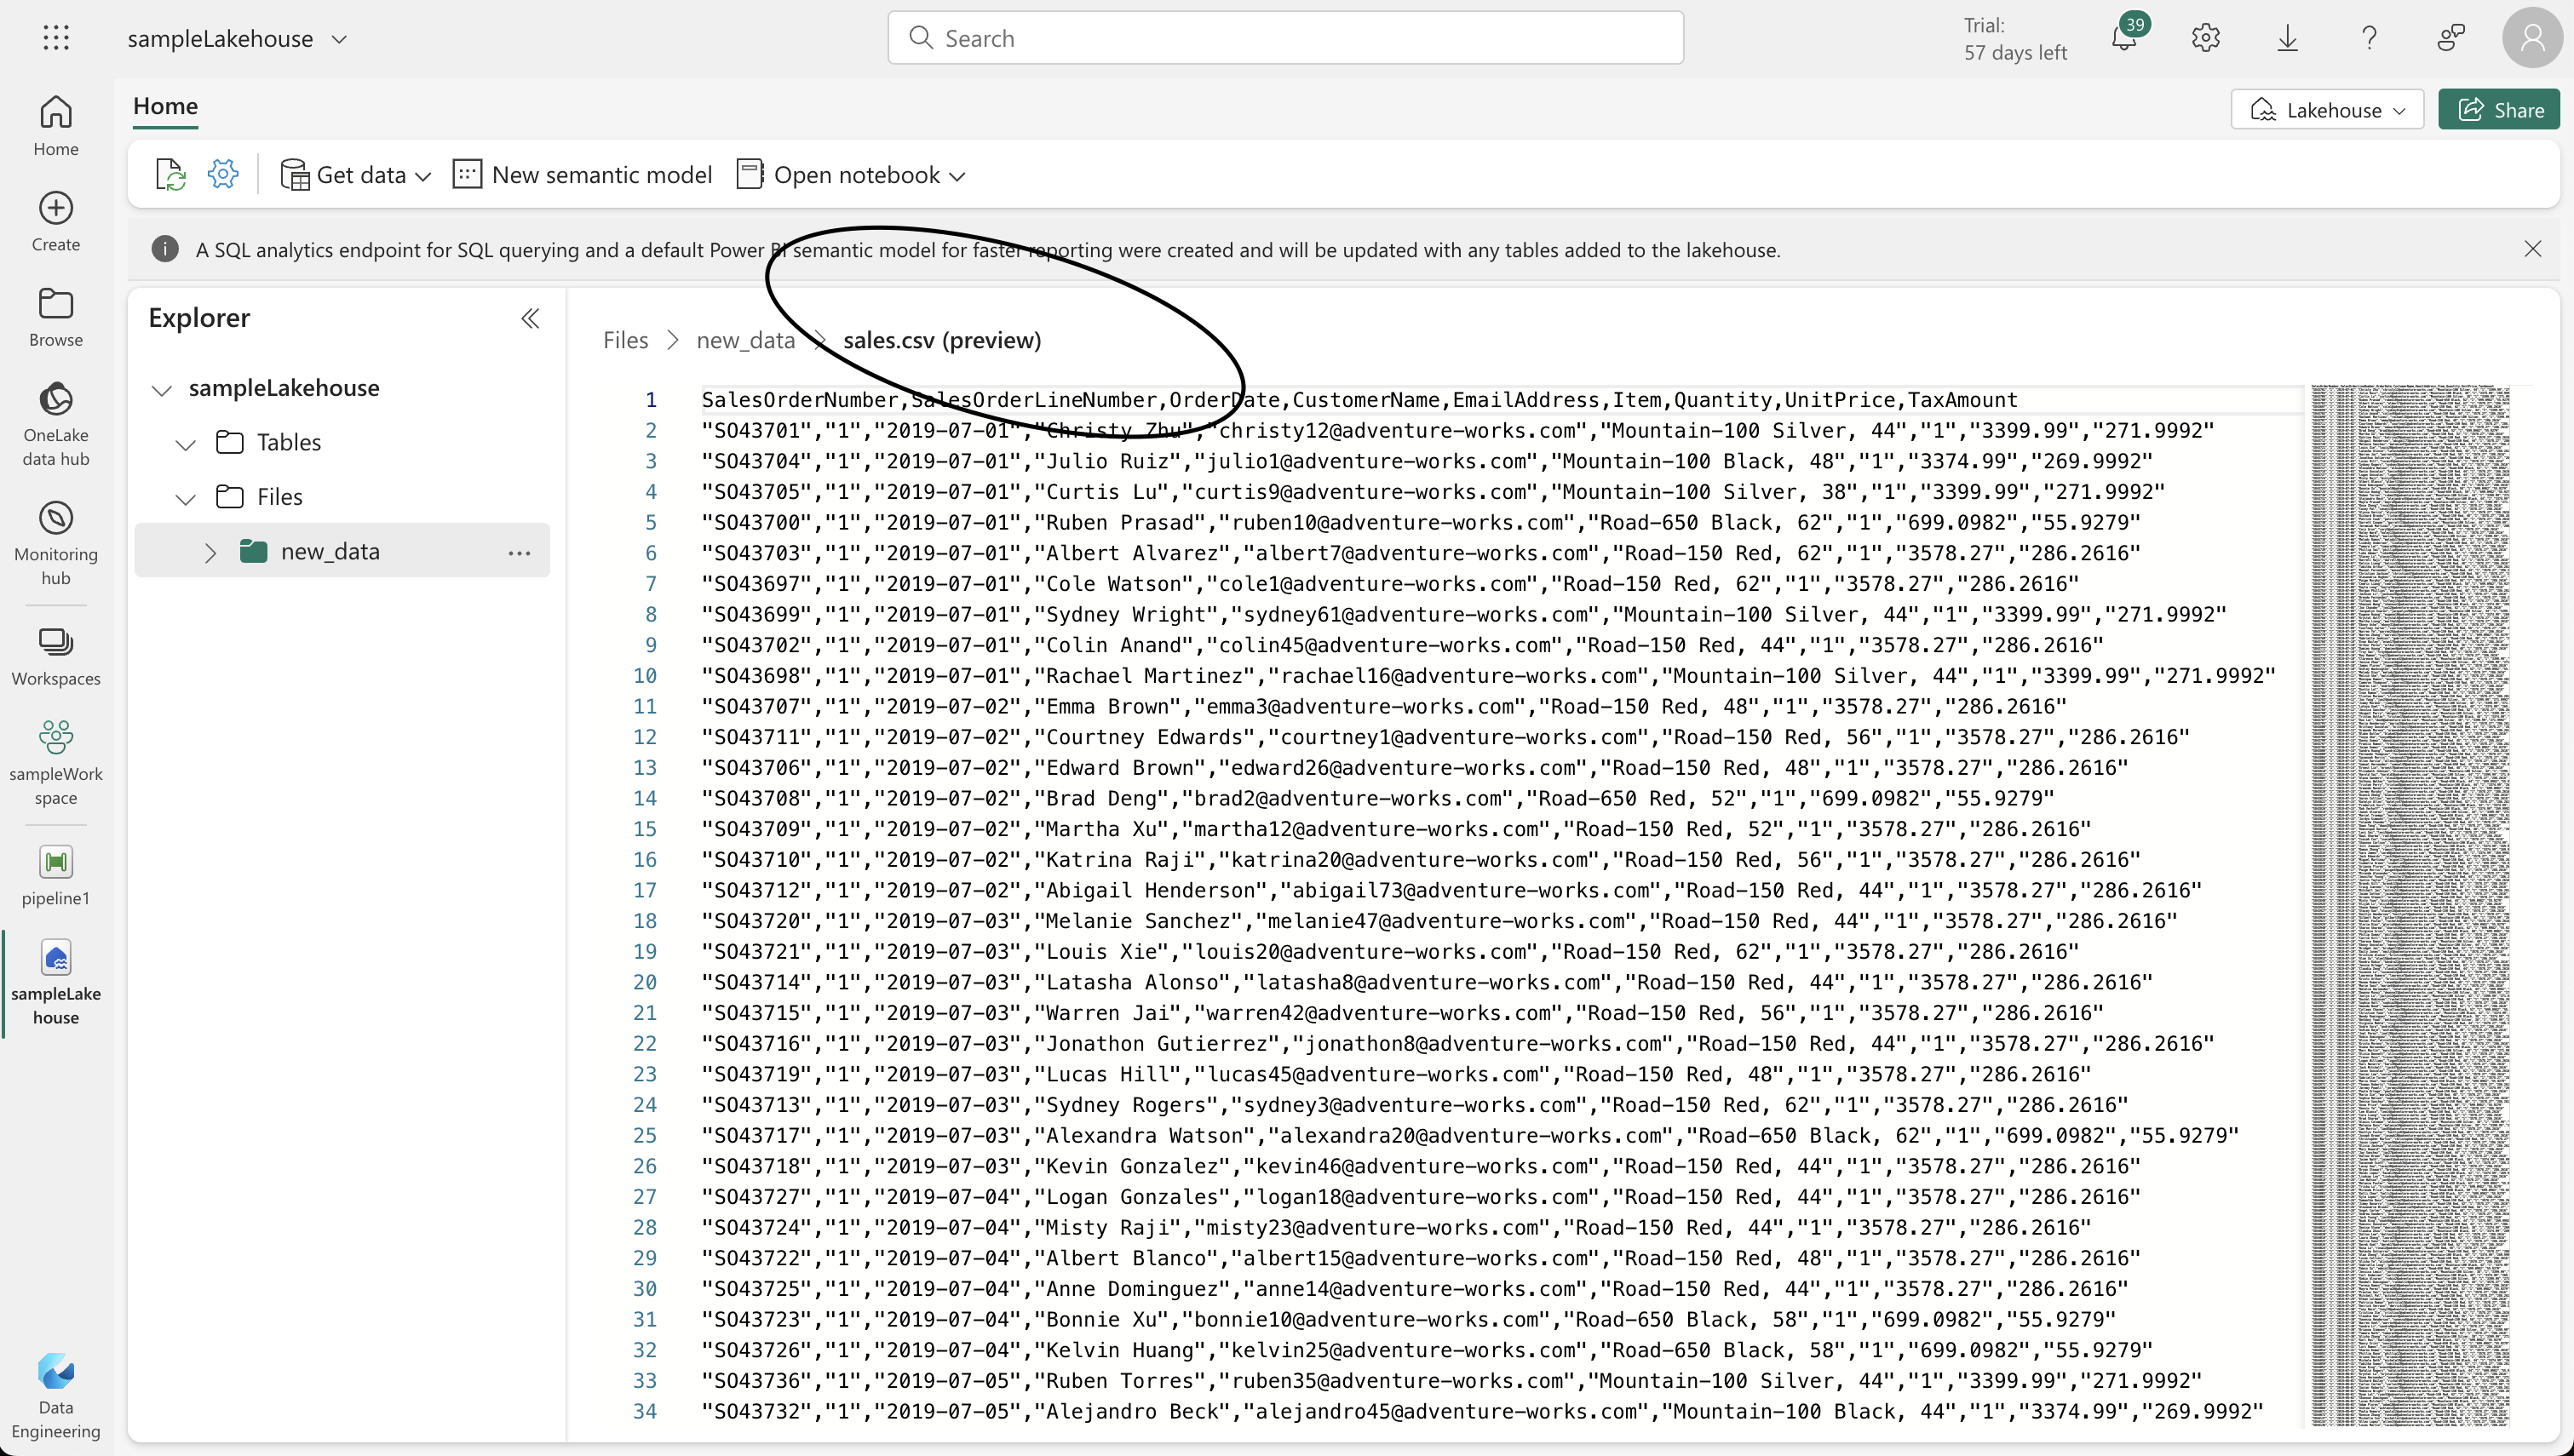
- On the Lake view tab, use the … menu for the Files node to create a new subfolder named “new_data.”
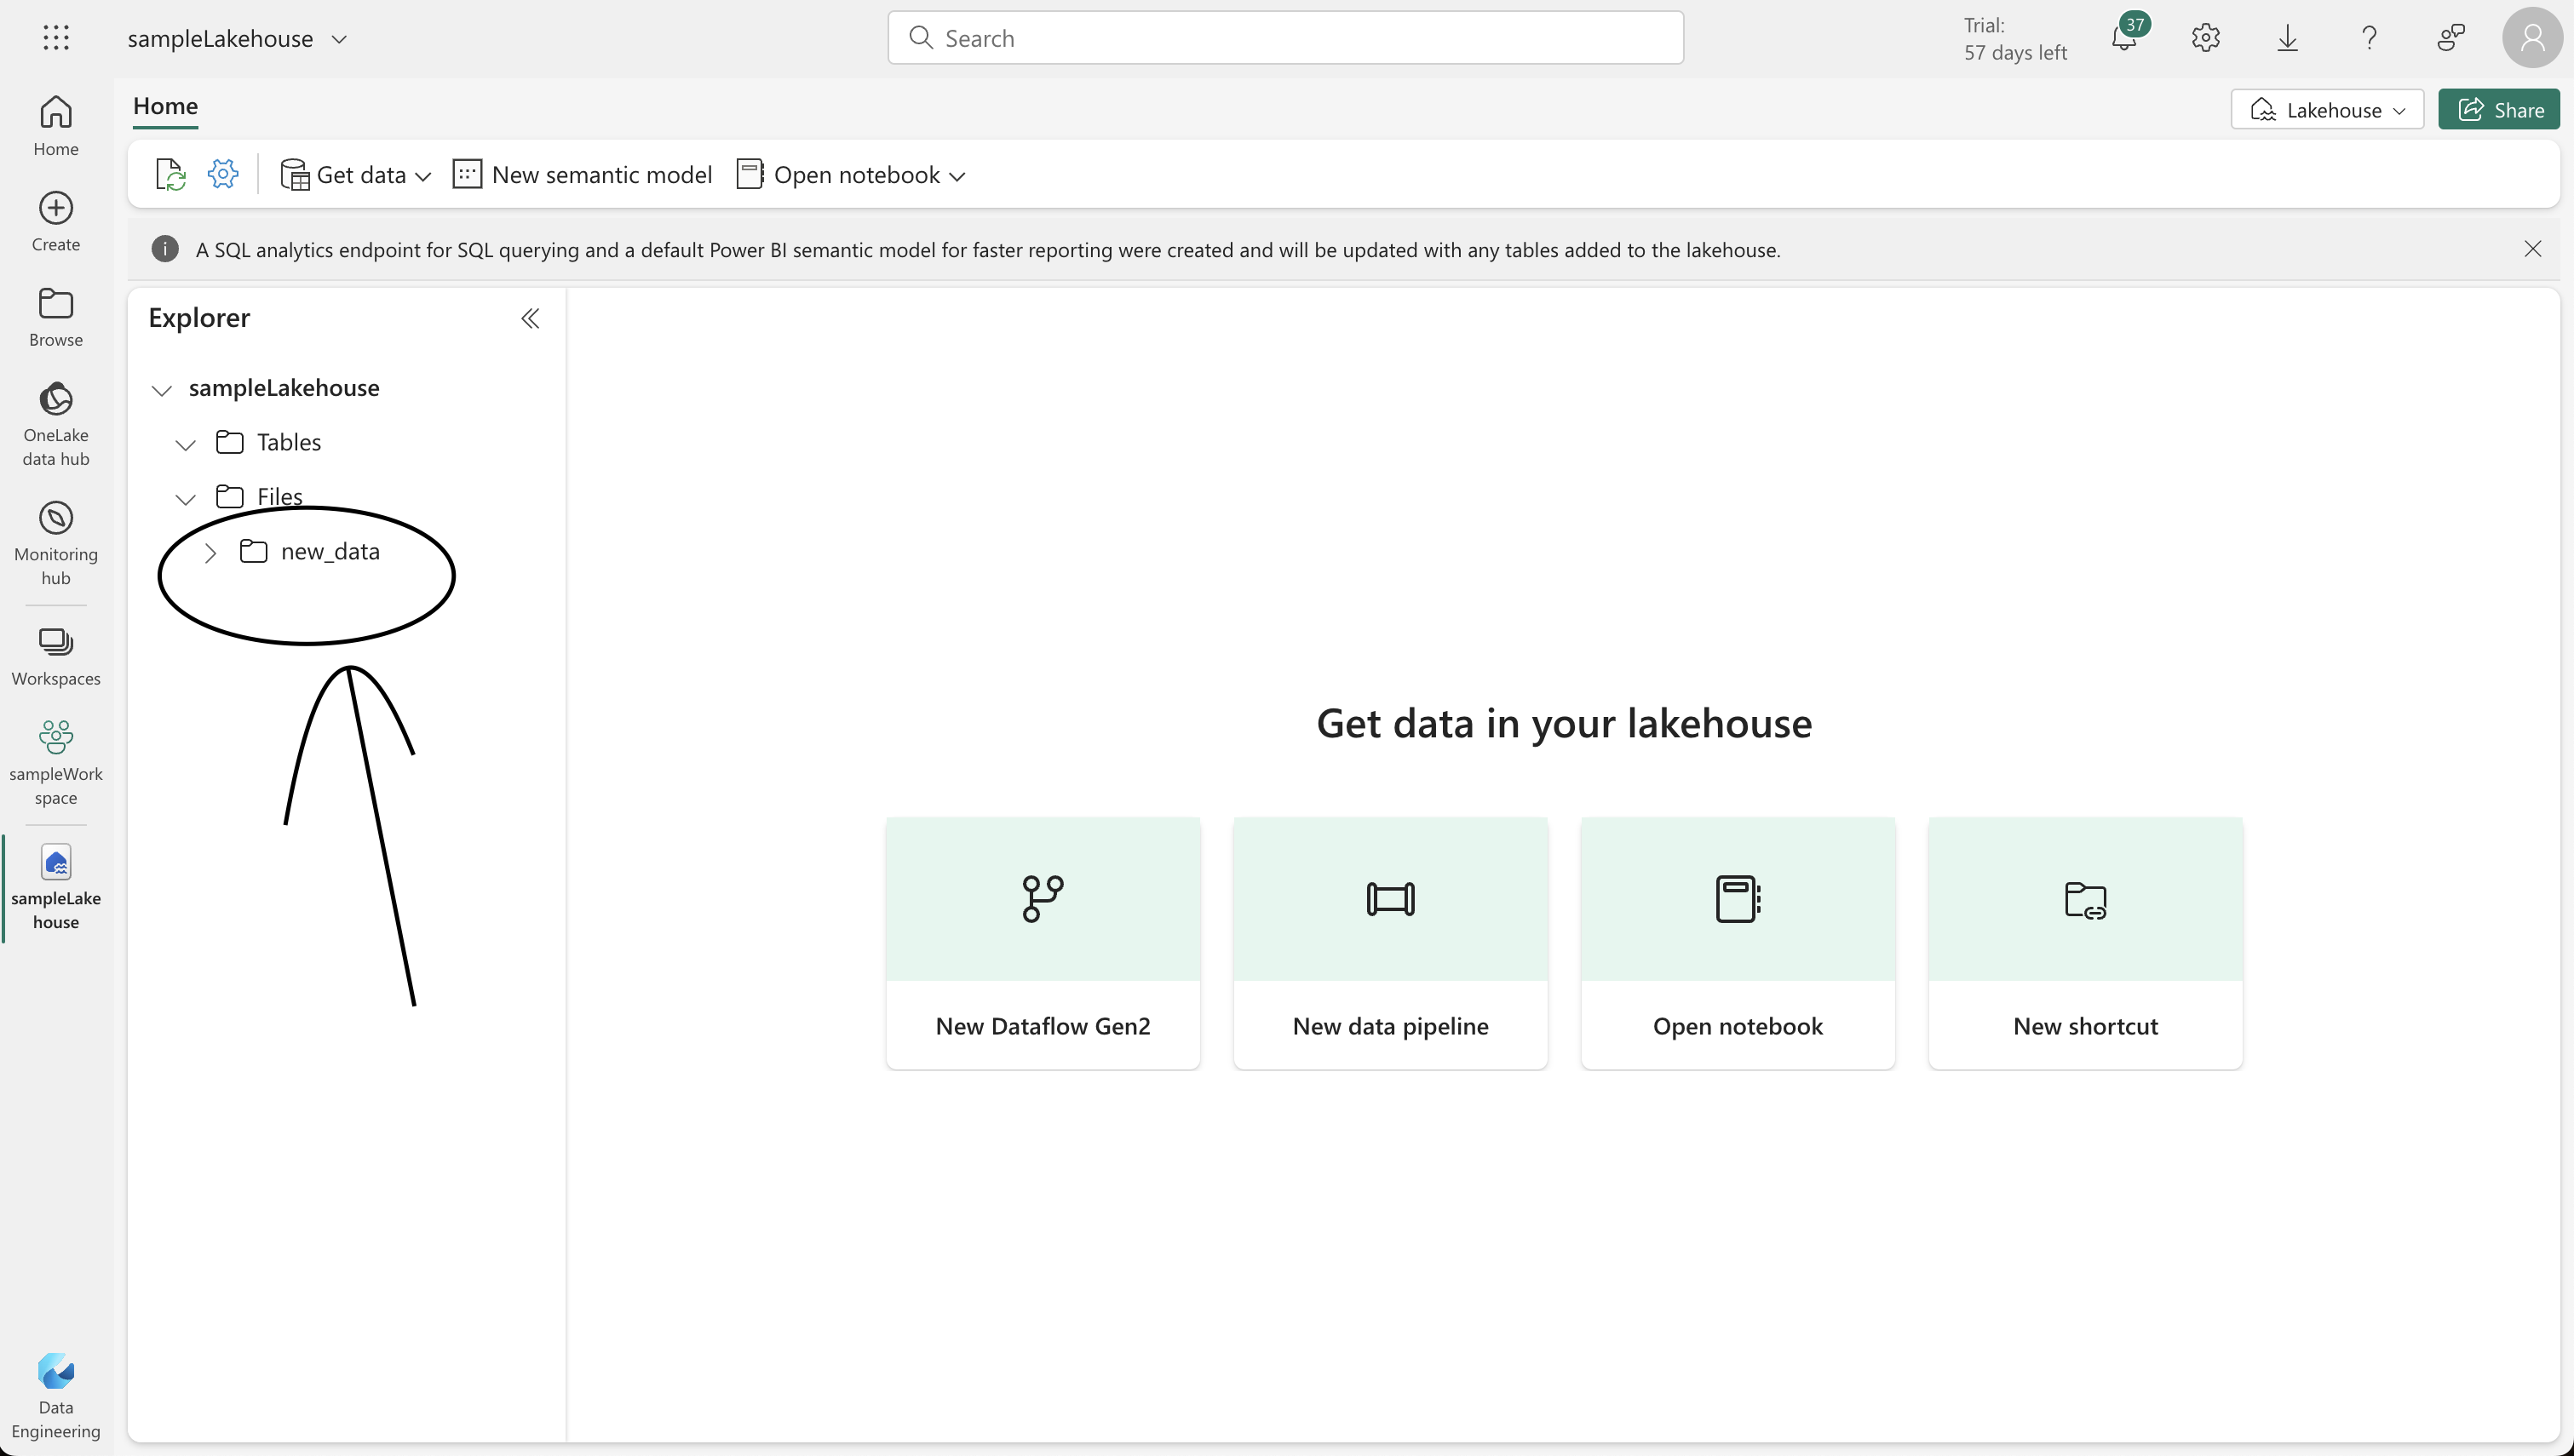
4. Setting Up a Data Pipeline
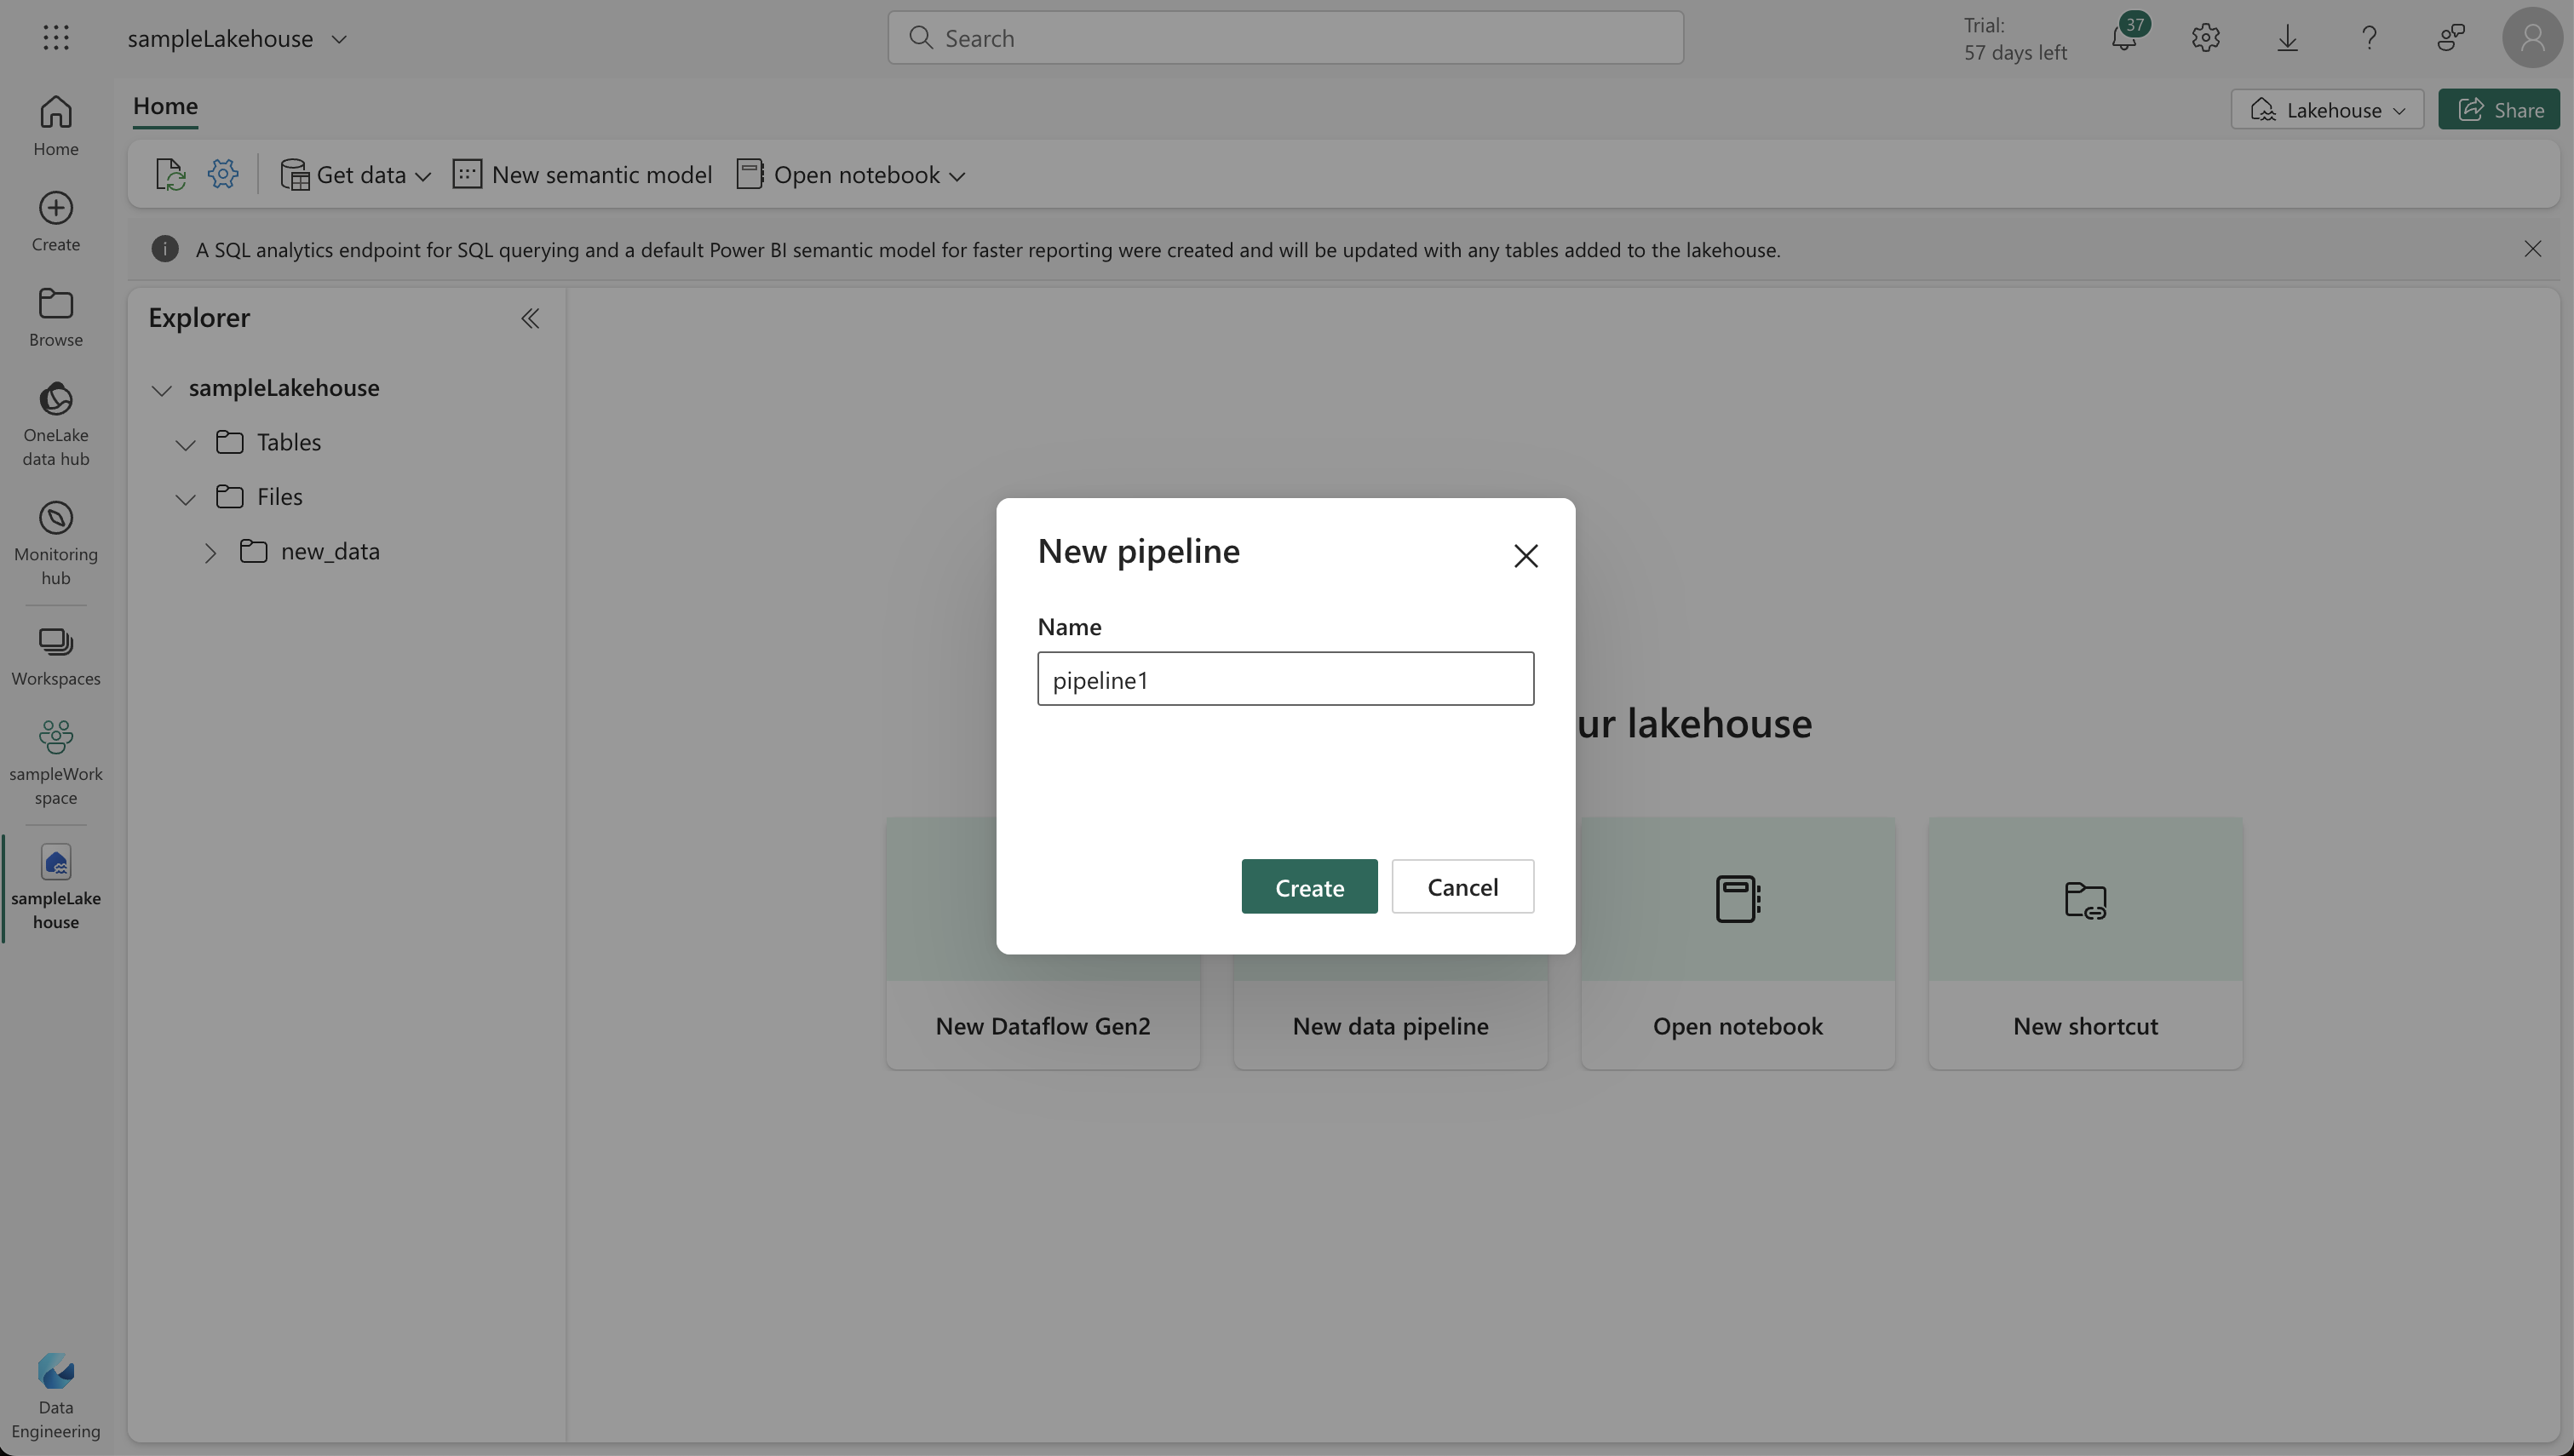
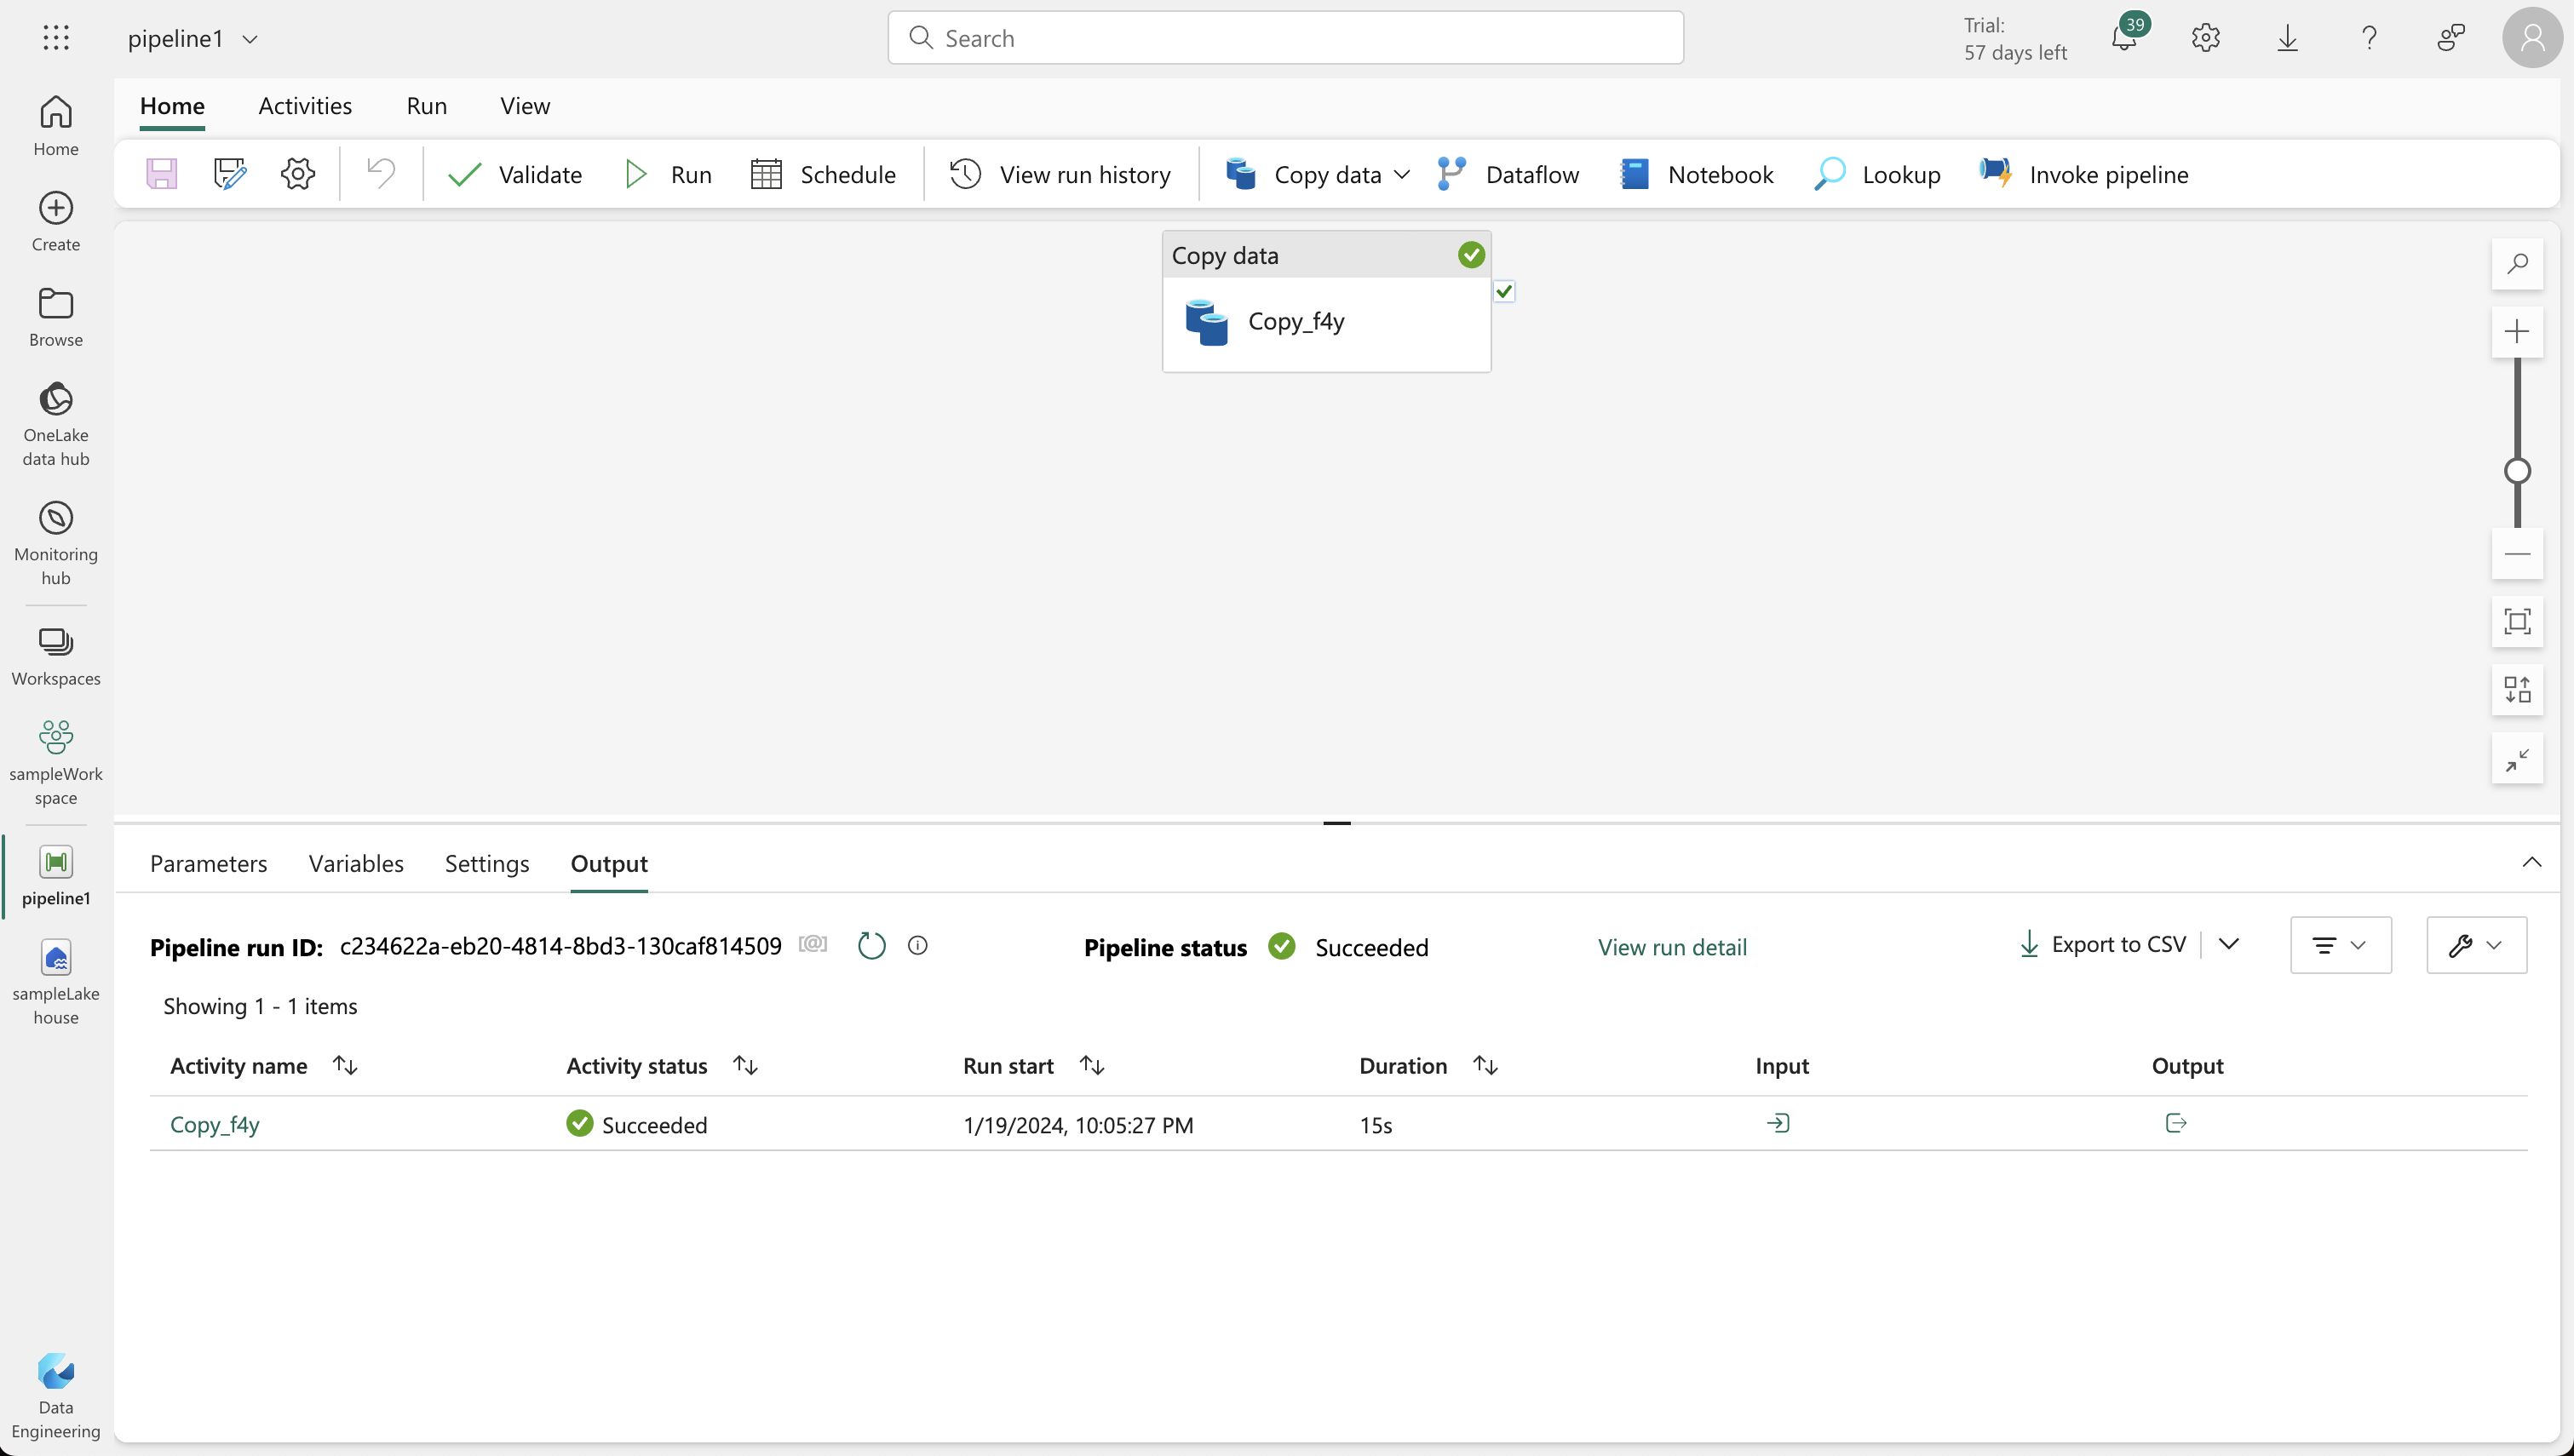
- In your lakehouse home page, select “New data pipeline” and create one named “Ingest Sales Data.”
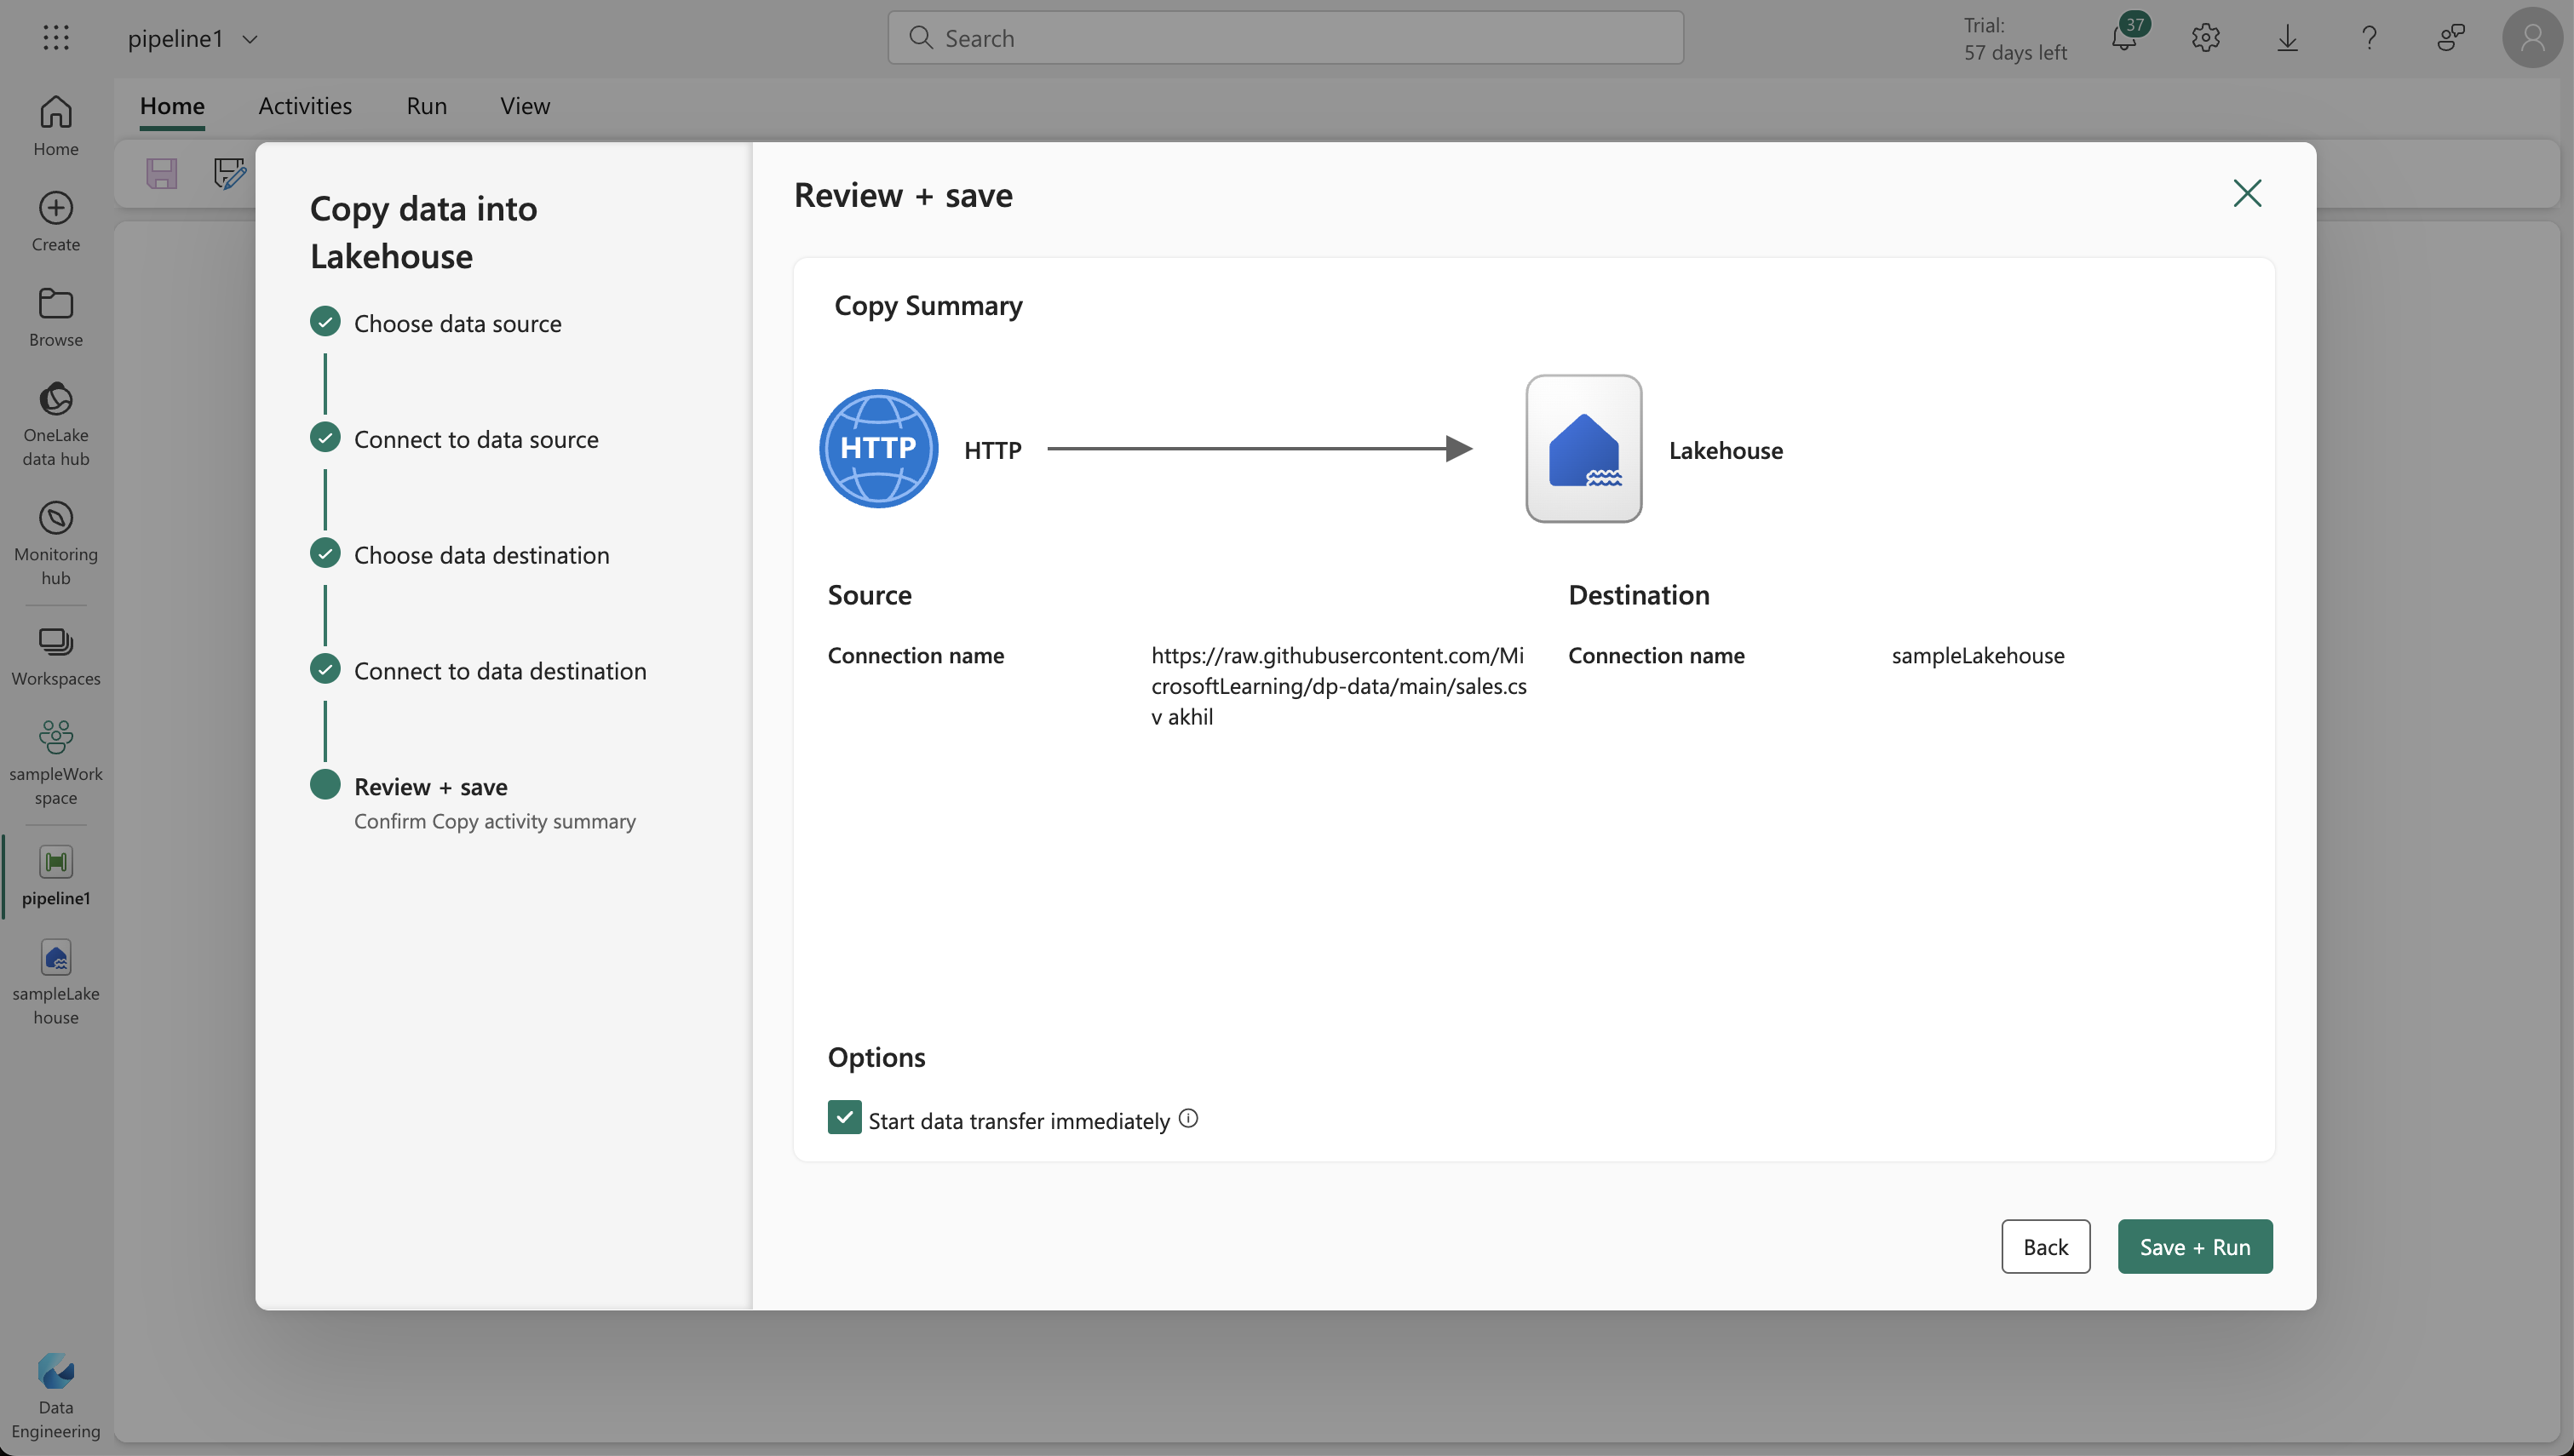
- Use the Copy Data wizard to set up data extraction from a source (HTTP protocol) to your lakehouse.
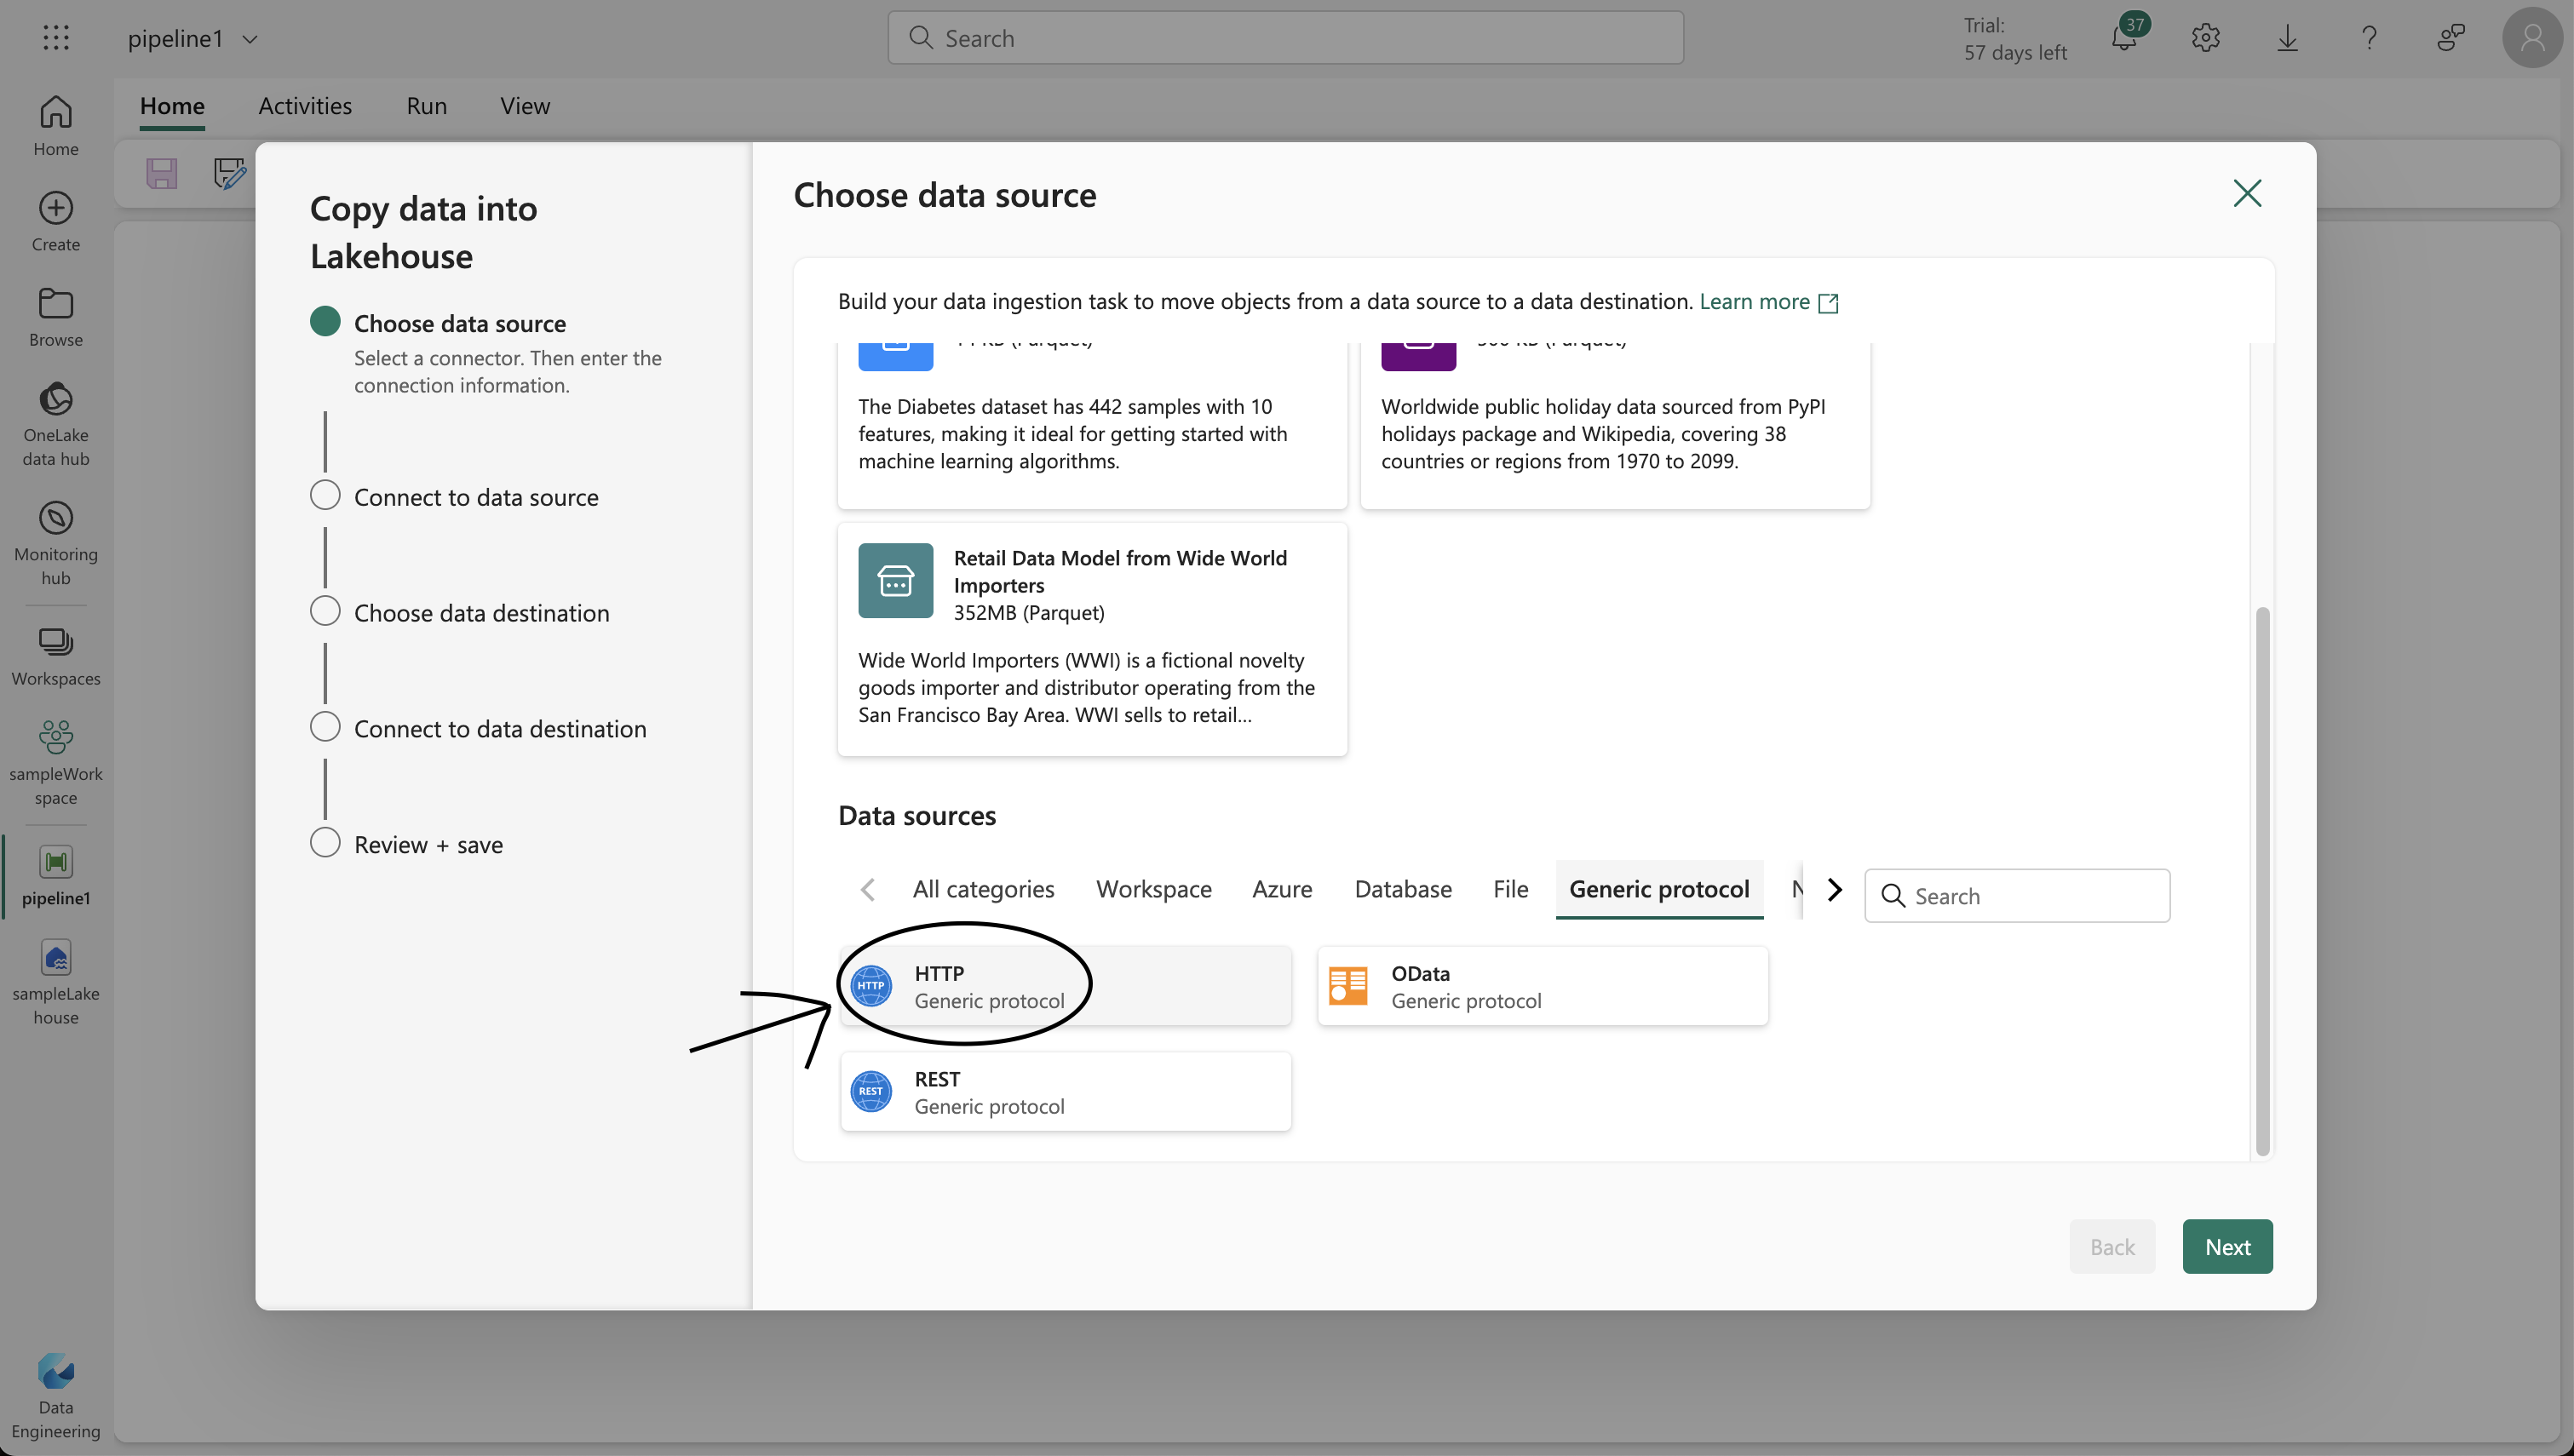
- Configure the connection to the data source with the URL
https://raw.githubusercontent.com/MicrosoftLearning/dp-data/main/sales.csv, using basic authentication without username or password.
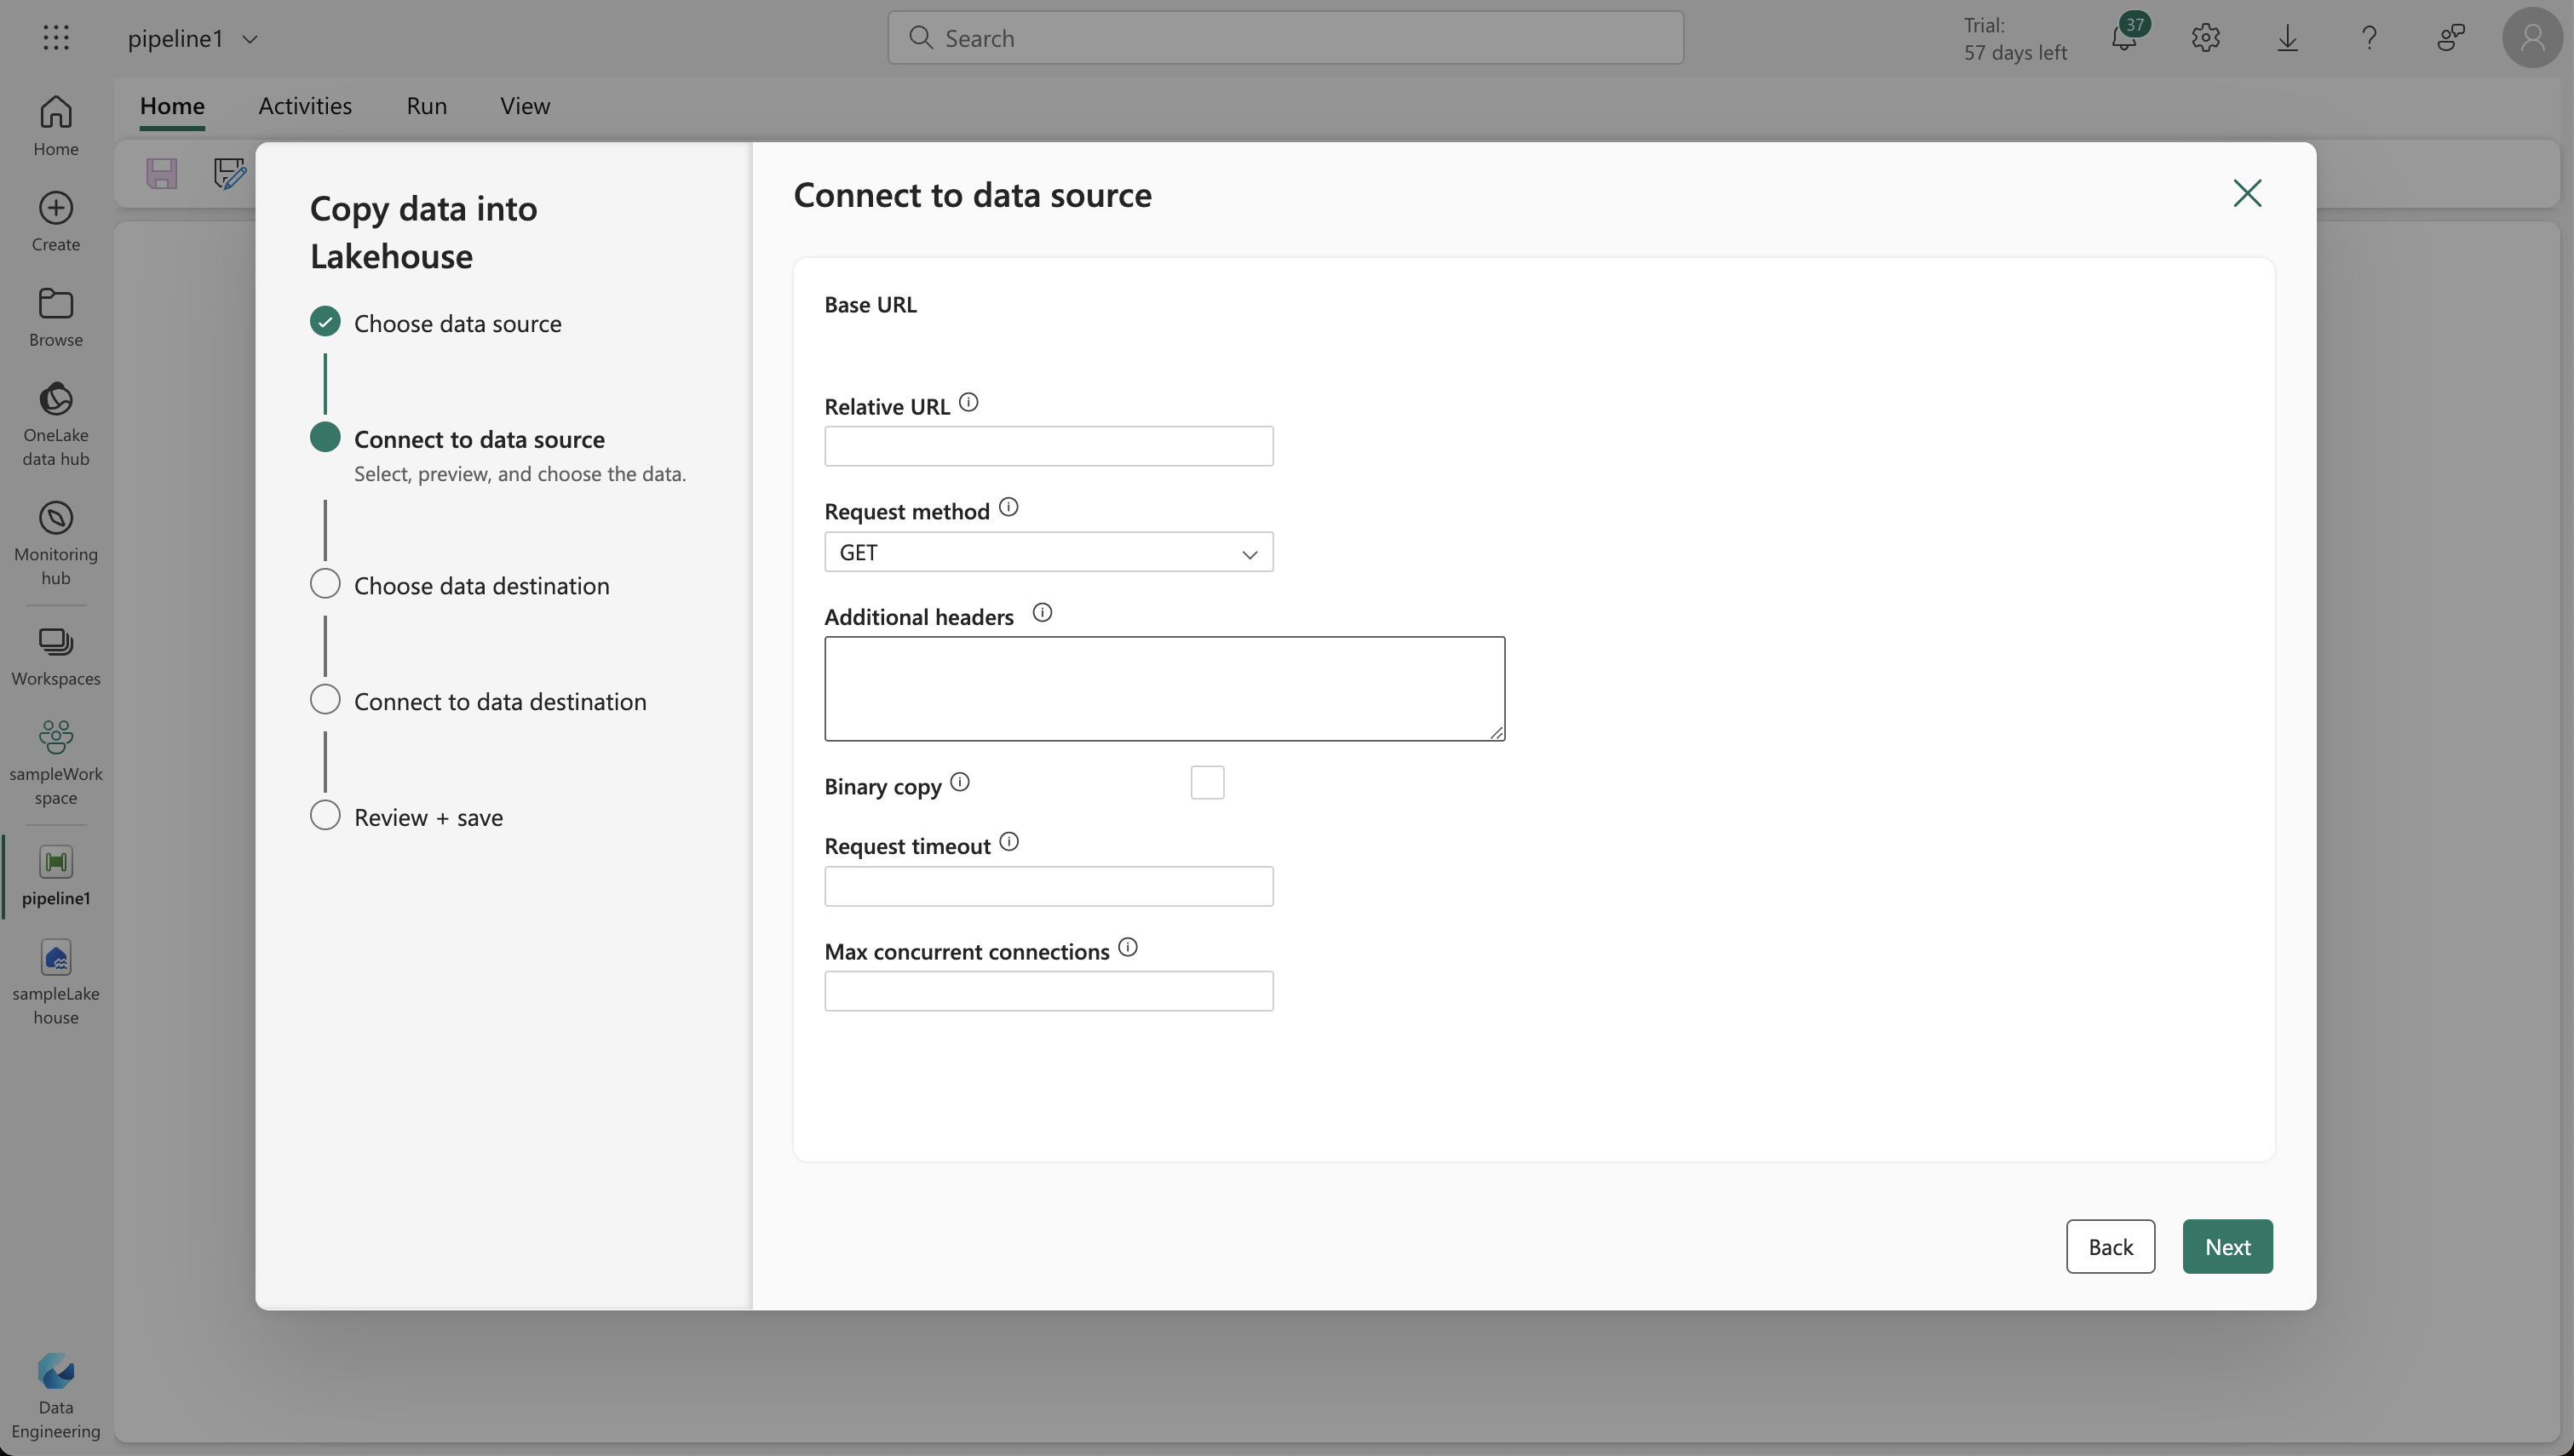
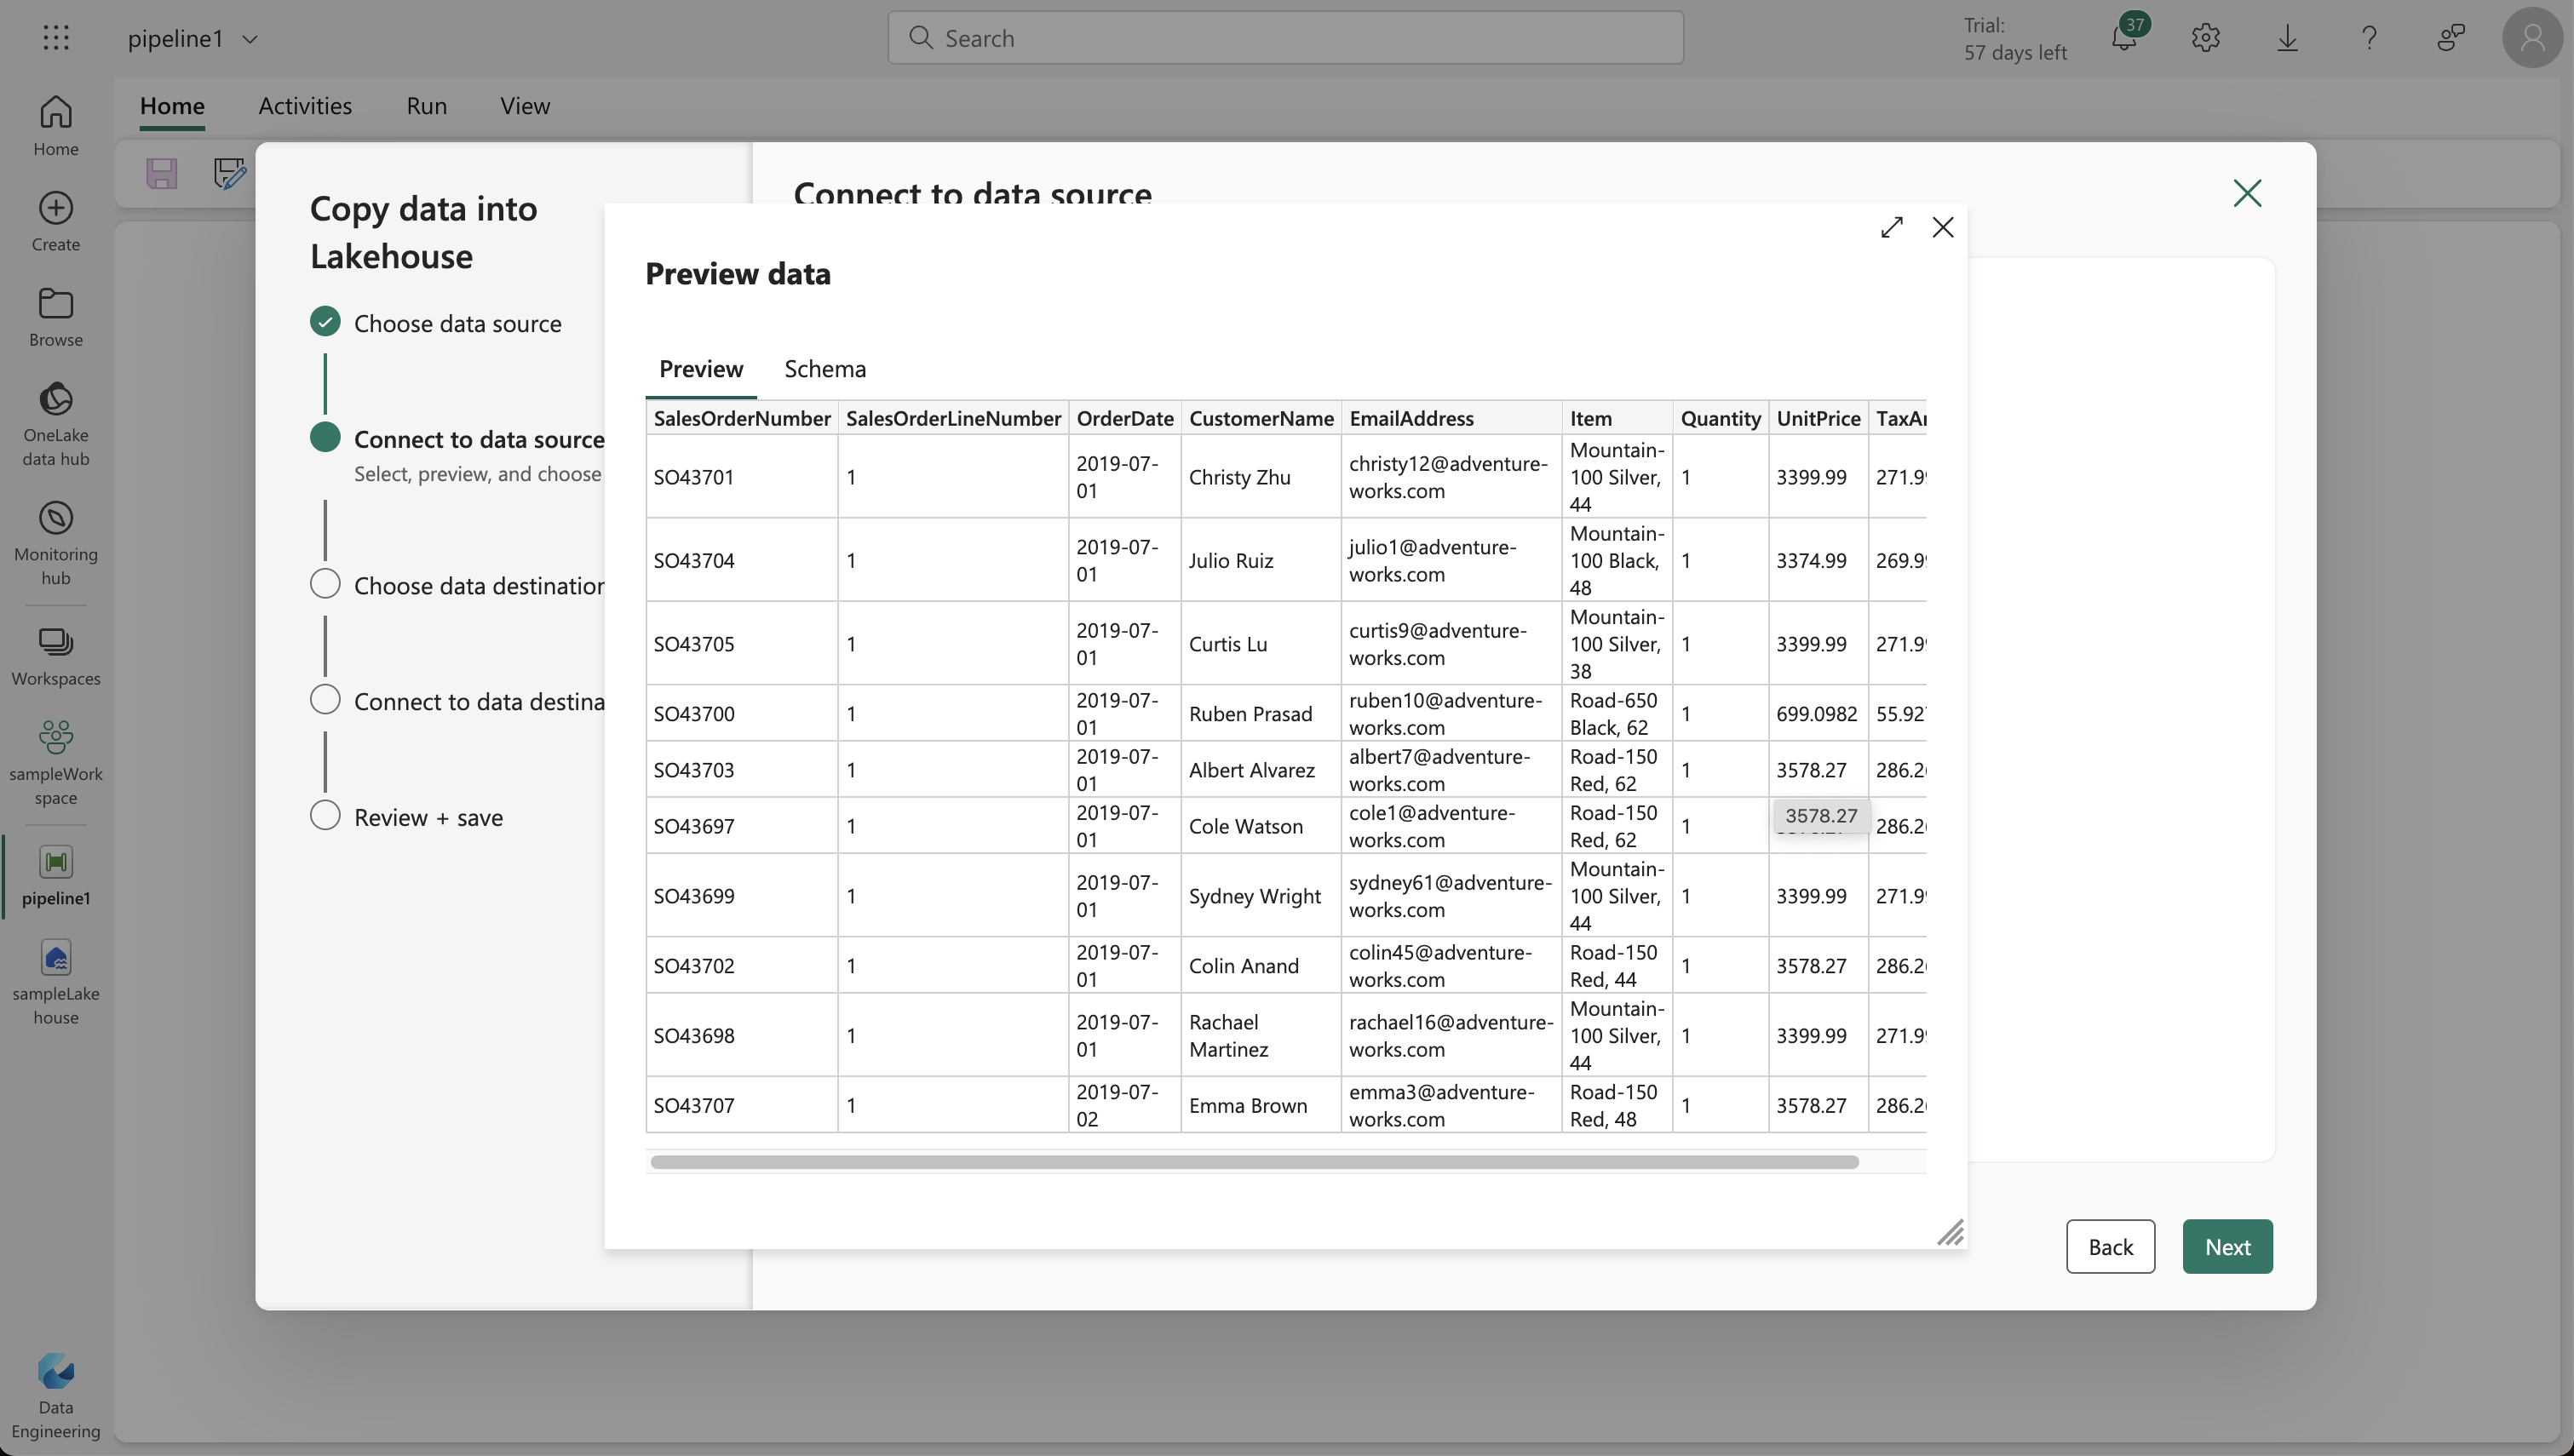
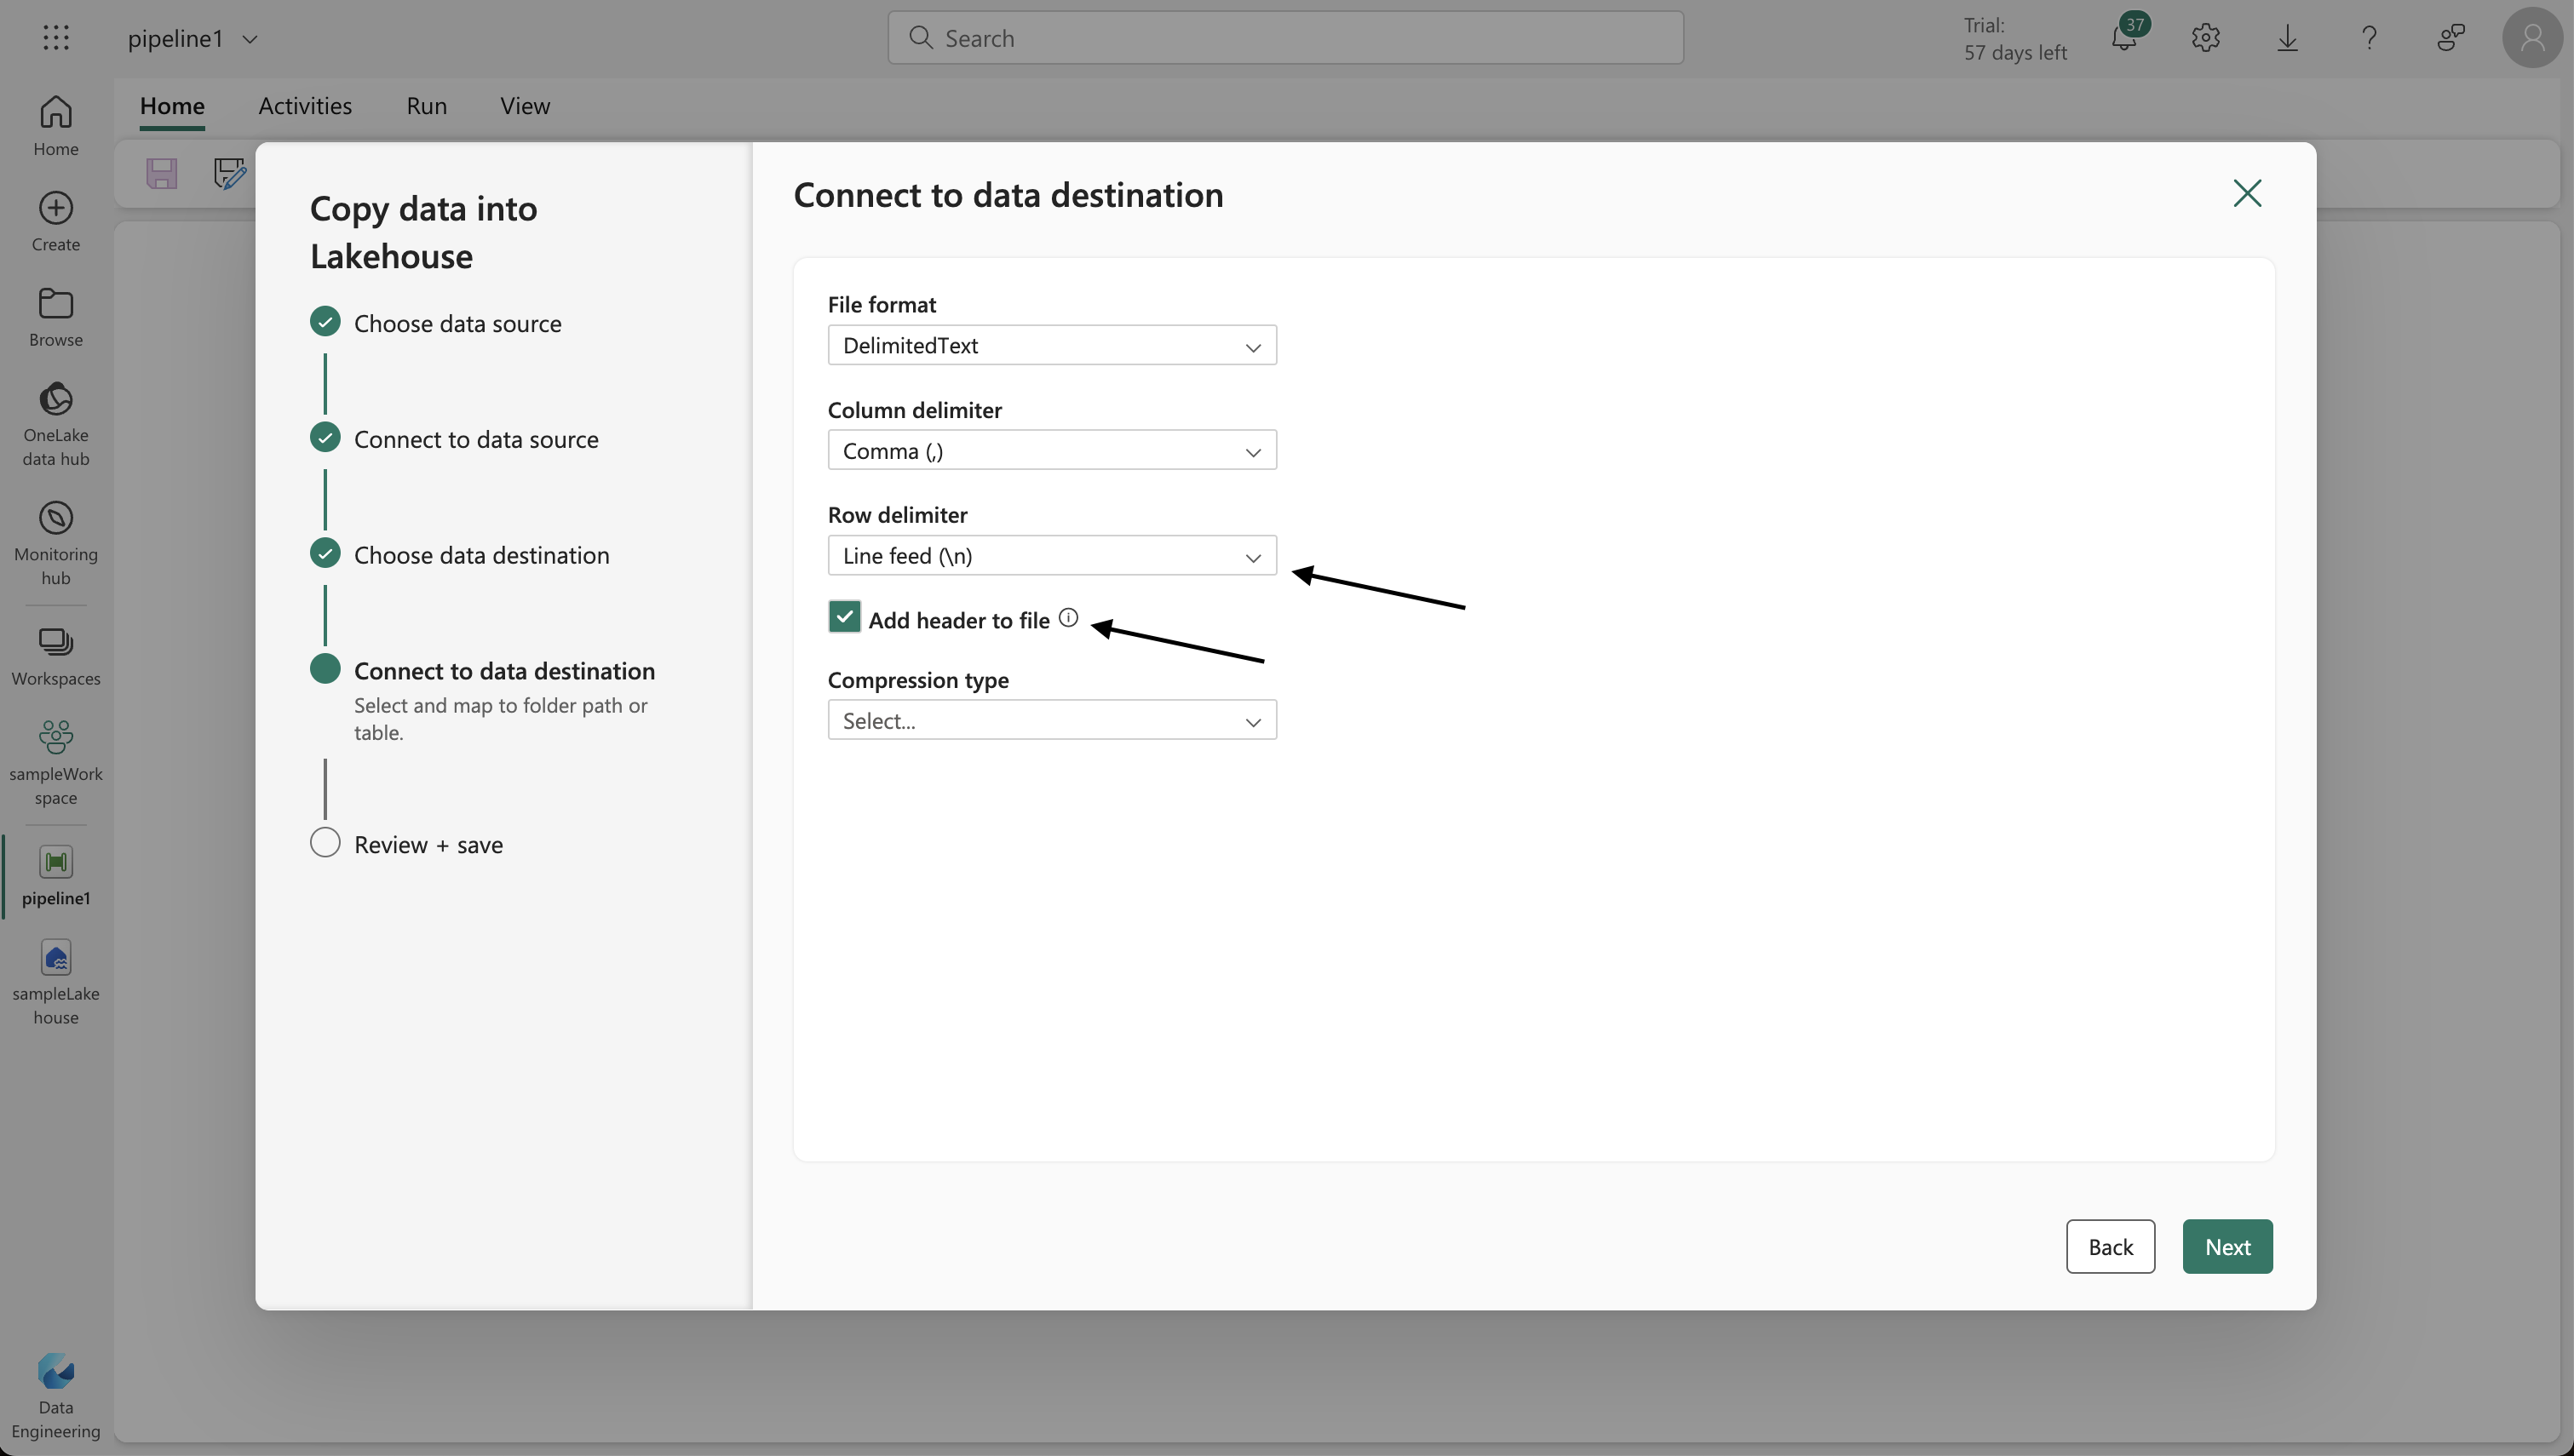
- Set file format options to read the CSV file correctly.
5. Creating and Running a Notebook
- On your lakehouse home page, create a new notebook.
- Replace the default code in the existing cell with a variable declaration for
table_name. - Add a new code cell to transform the data from the CSV file and save it as a table named “sales.”
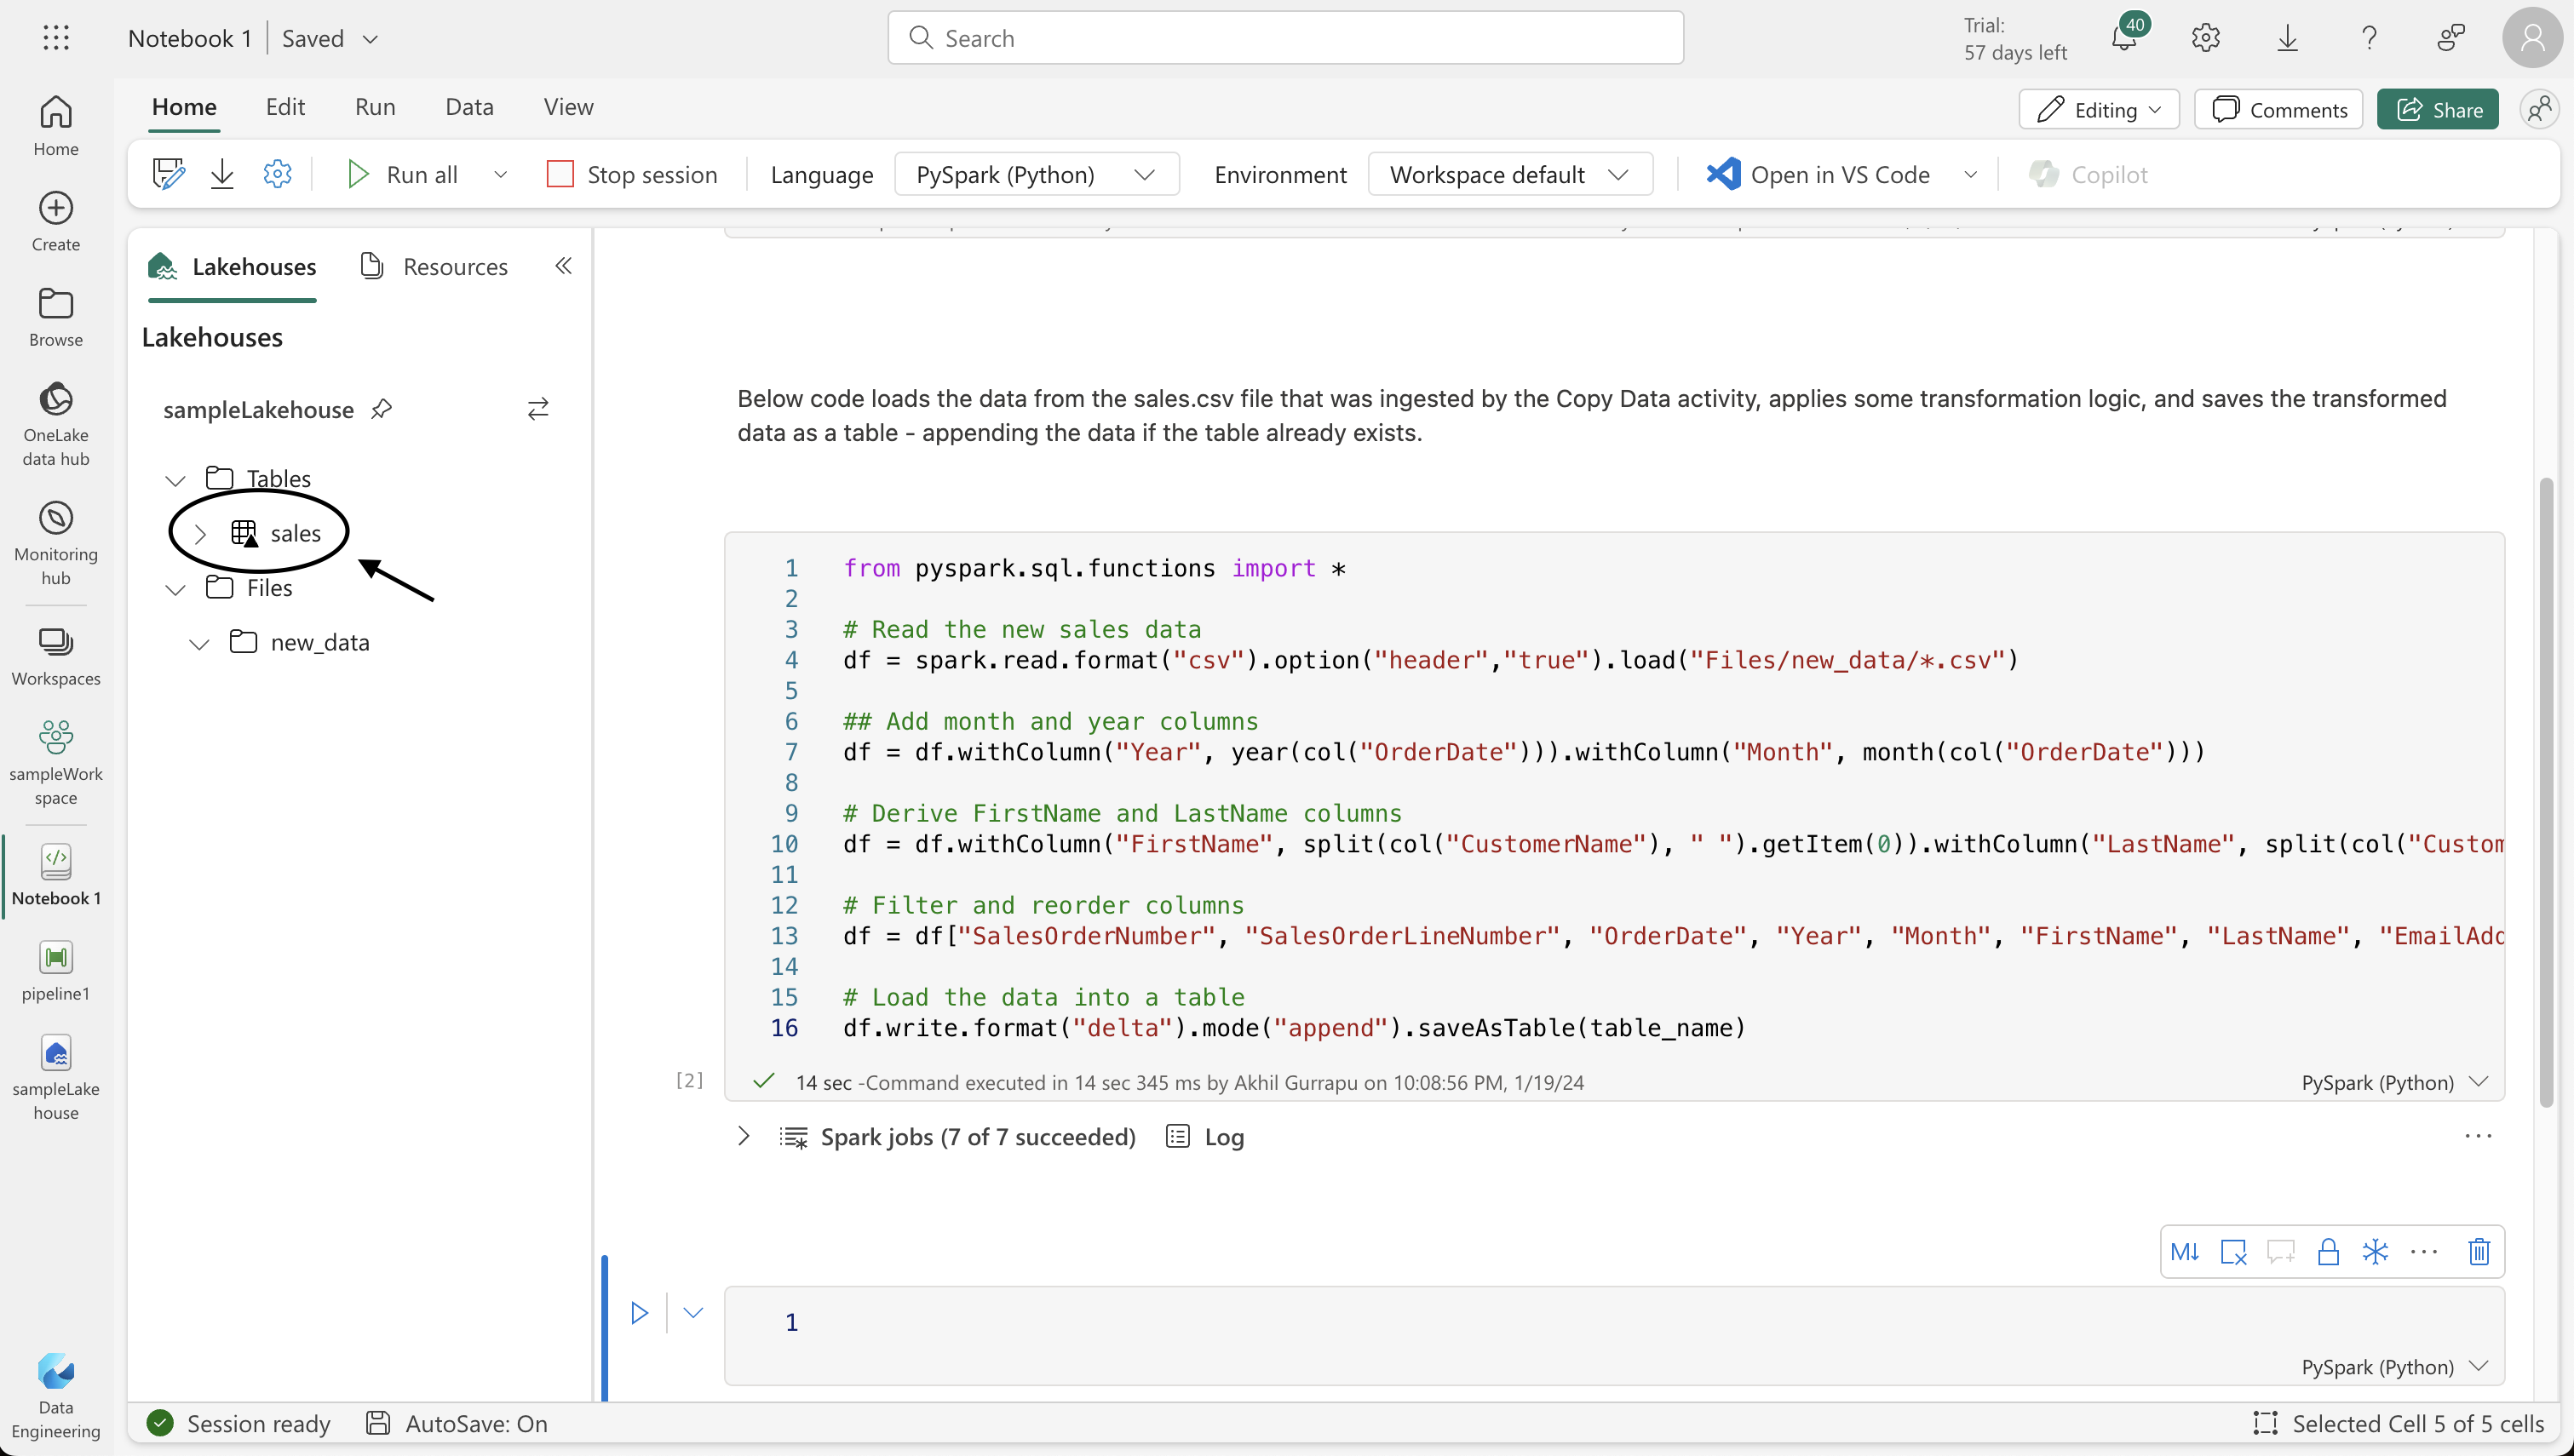
Data Transformation and Loading:
- Creating a notebook in Fabric to transform the ingested data.
- Using Python code with Spark functions to process the data, adding necessary columns, filtering, and reordering.
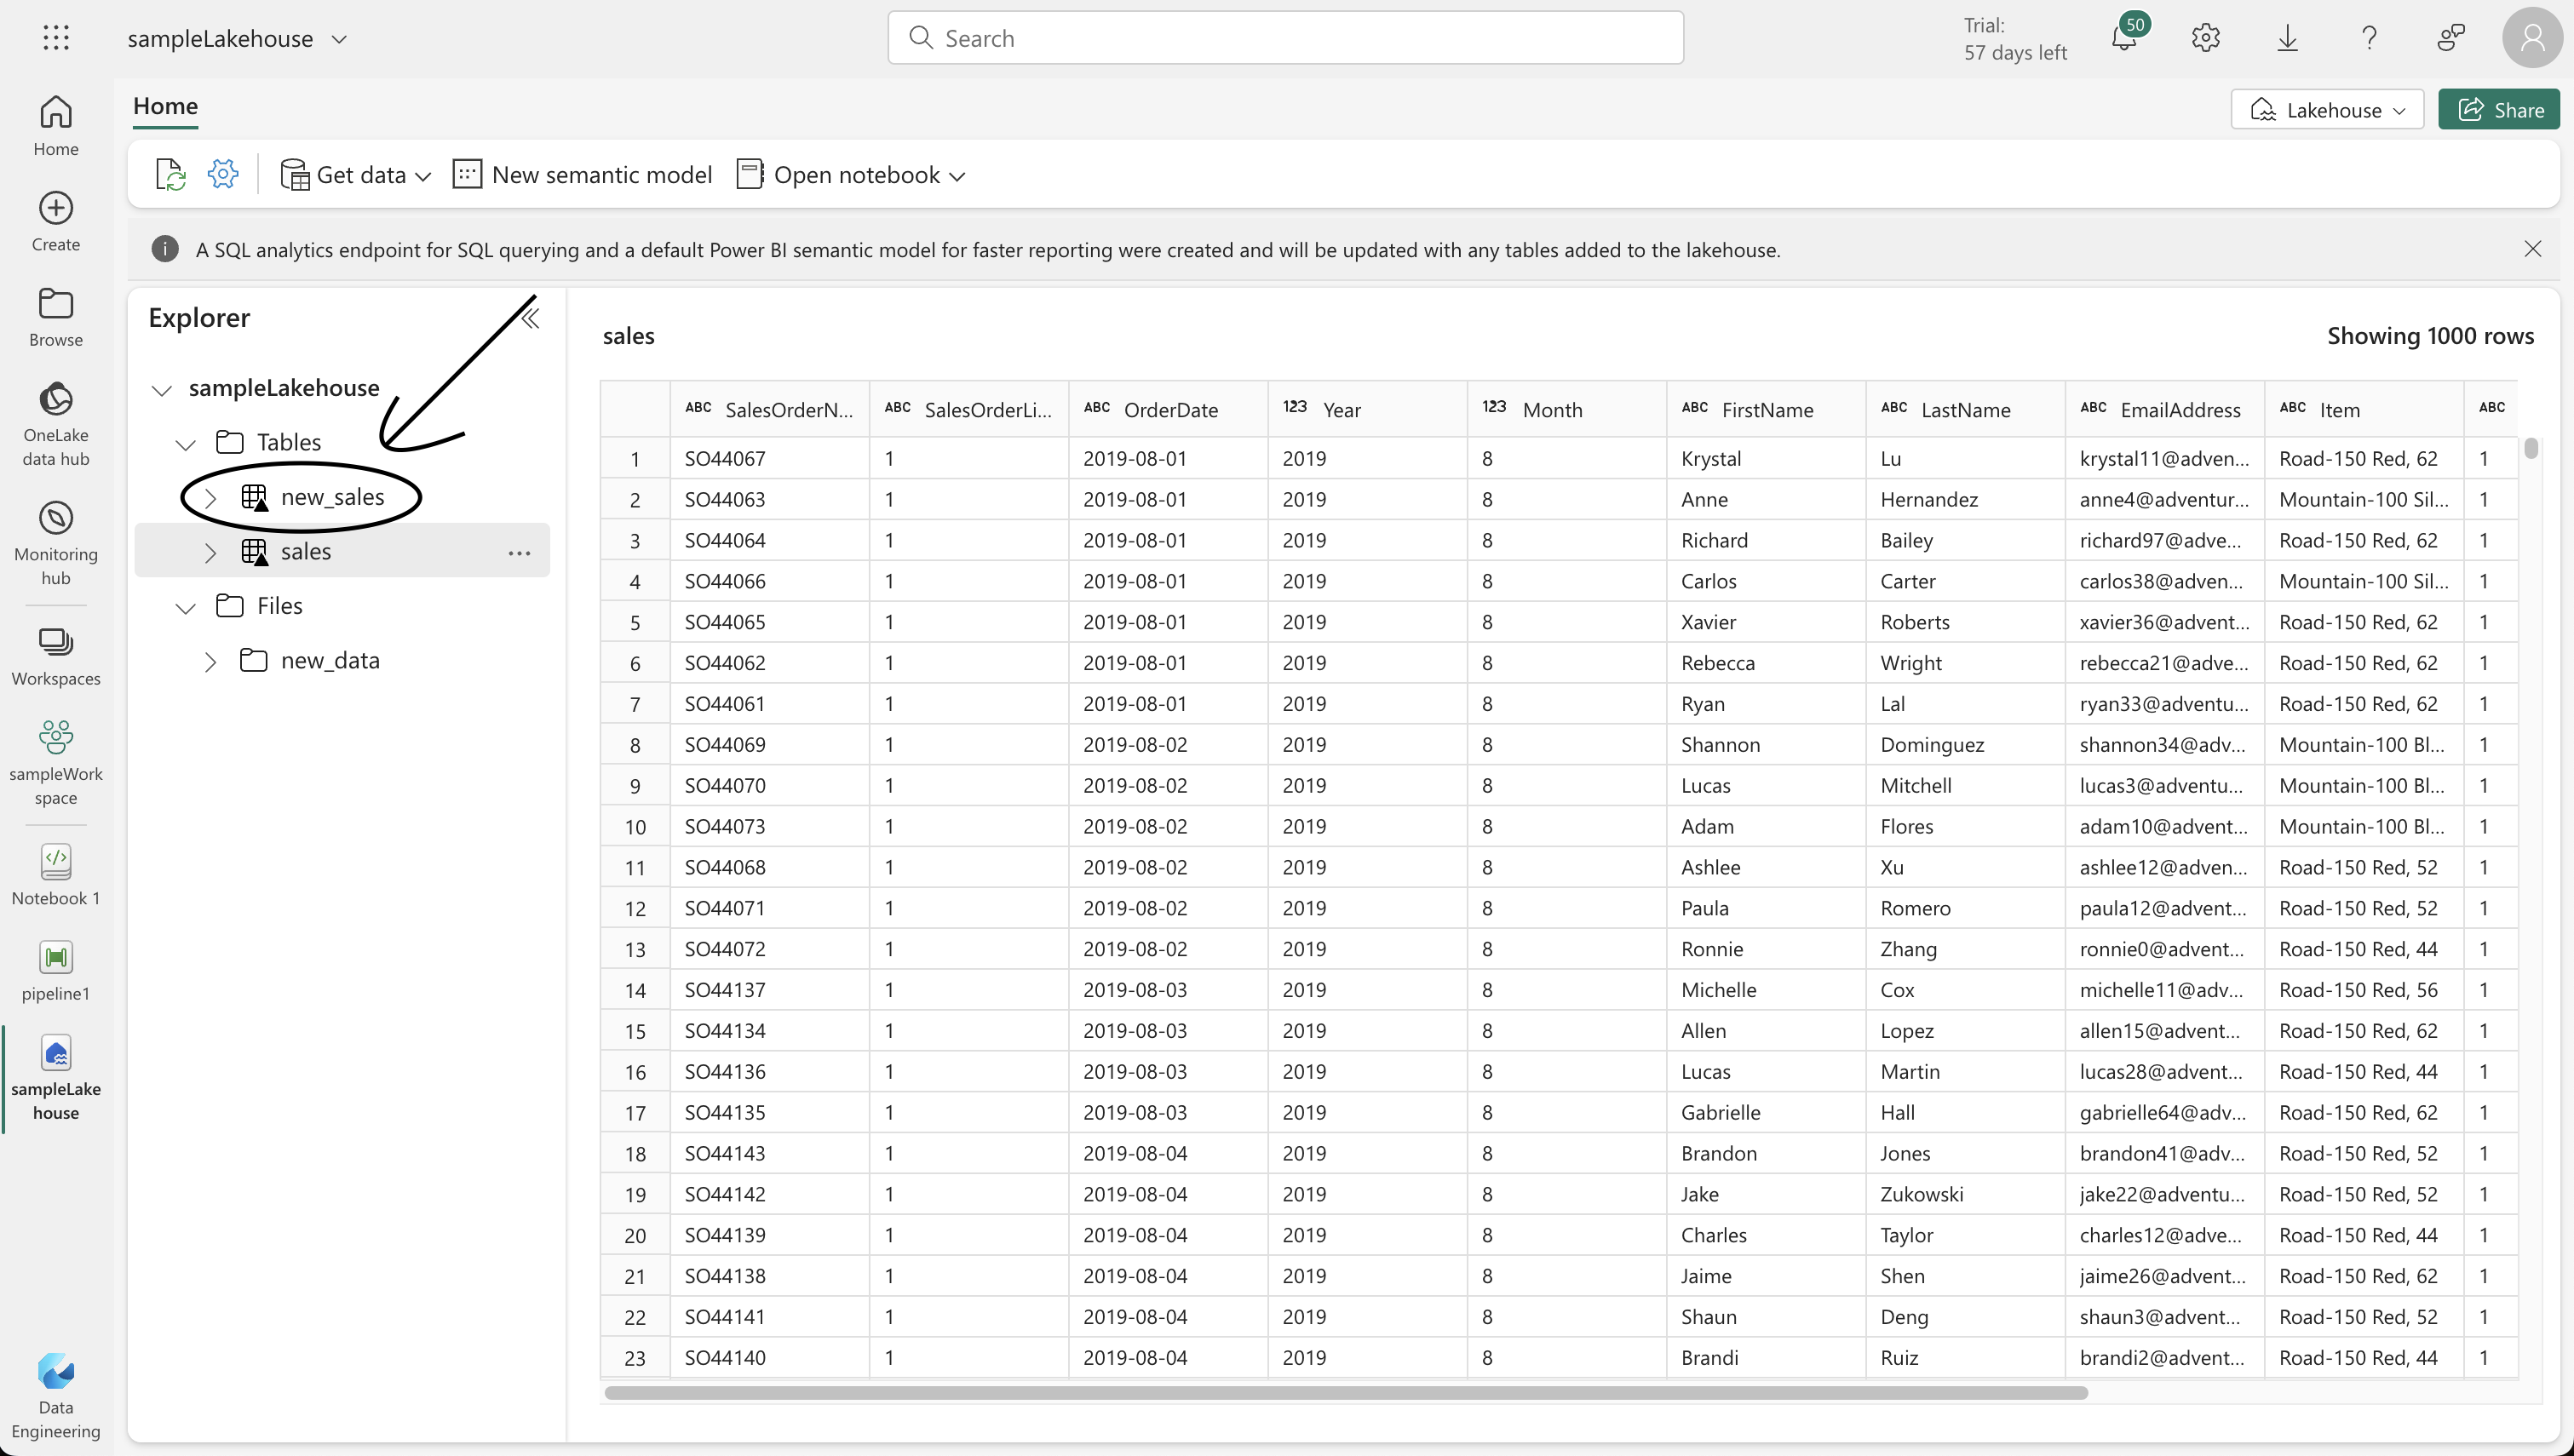
- Loading the processed data into a table for analysis, appending it if the table already exists.
table_name = "sales"StatementMeta(, 2bf3e420-cde0-471d-ab4e-bcd863565b2b, 3, Finished, Available)
Below code loads the data from the sales.csv file that was ingested by the Copy Data activity, applies some transformation logic, and saves the transformed data as a table - appending the data if the table already exists.
from pyspark.sql.functions import *

# Read the new sales data
df = spark.read.format("csv").option("header","true").load("Files/new_data/*.csv")

## Add month and year columns
df = df.withColumn("Year", year(col("OrderDate"))).withColumn("Month", month(col("OrderDate")))

# Derive FirstName and LastName columns
df = df.withColumn("FirstName", split(col("CustomerName"), " ").getItem(0)).withColumn("LastName", split(col("CustomerName"), " ").getItem(1))

# Filter and reorder columns
df = df["SalesOrderNumber", "SalesOrderLineNumber", "OrderDate", "Year", "Month", "FirstName", "LastName", "EmailAddress", "Item", "Quantity", "UnitPrice", "TaxAmount"]

# Load the data into a table
df.write.format("delta").mode("append").saveAsTable(table_name)
StatementMeta(, 2bf3e420-cde0-471d-ab4e-bcd863565b2b, 4, Finished, Available)
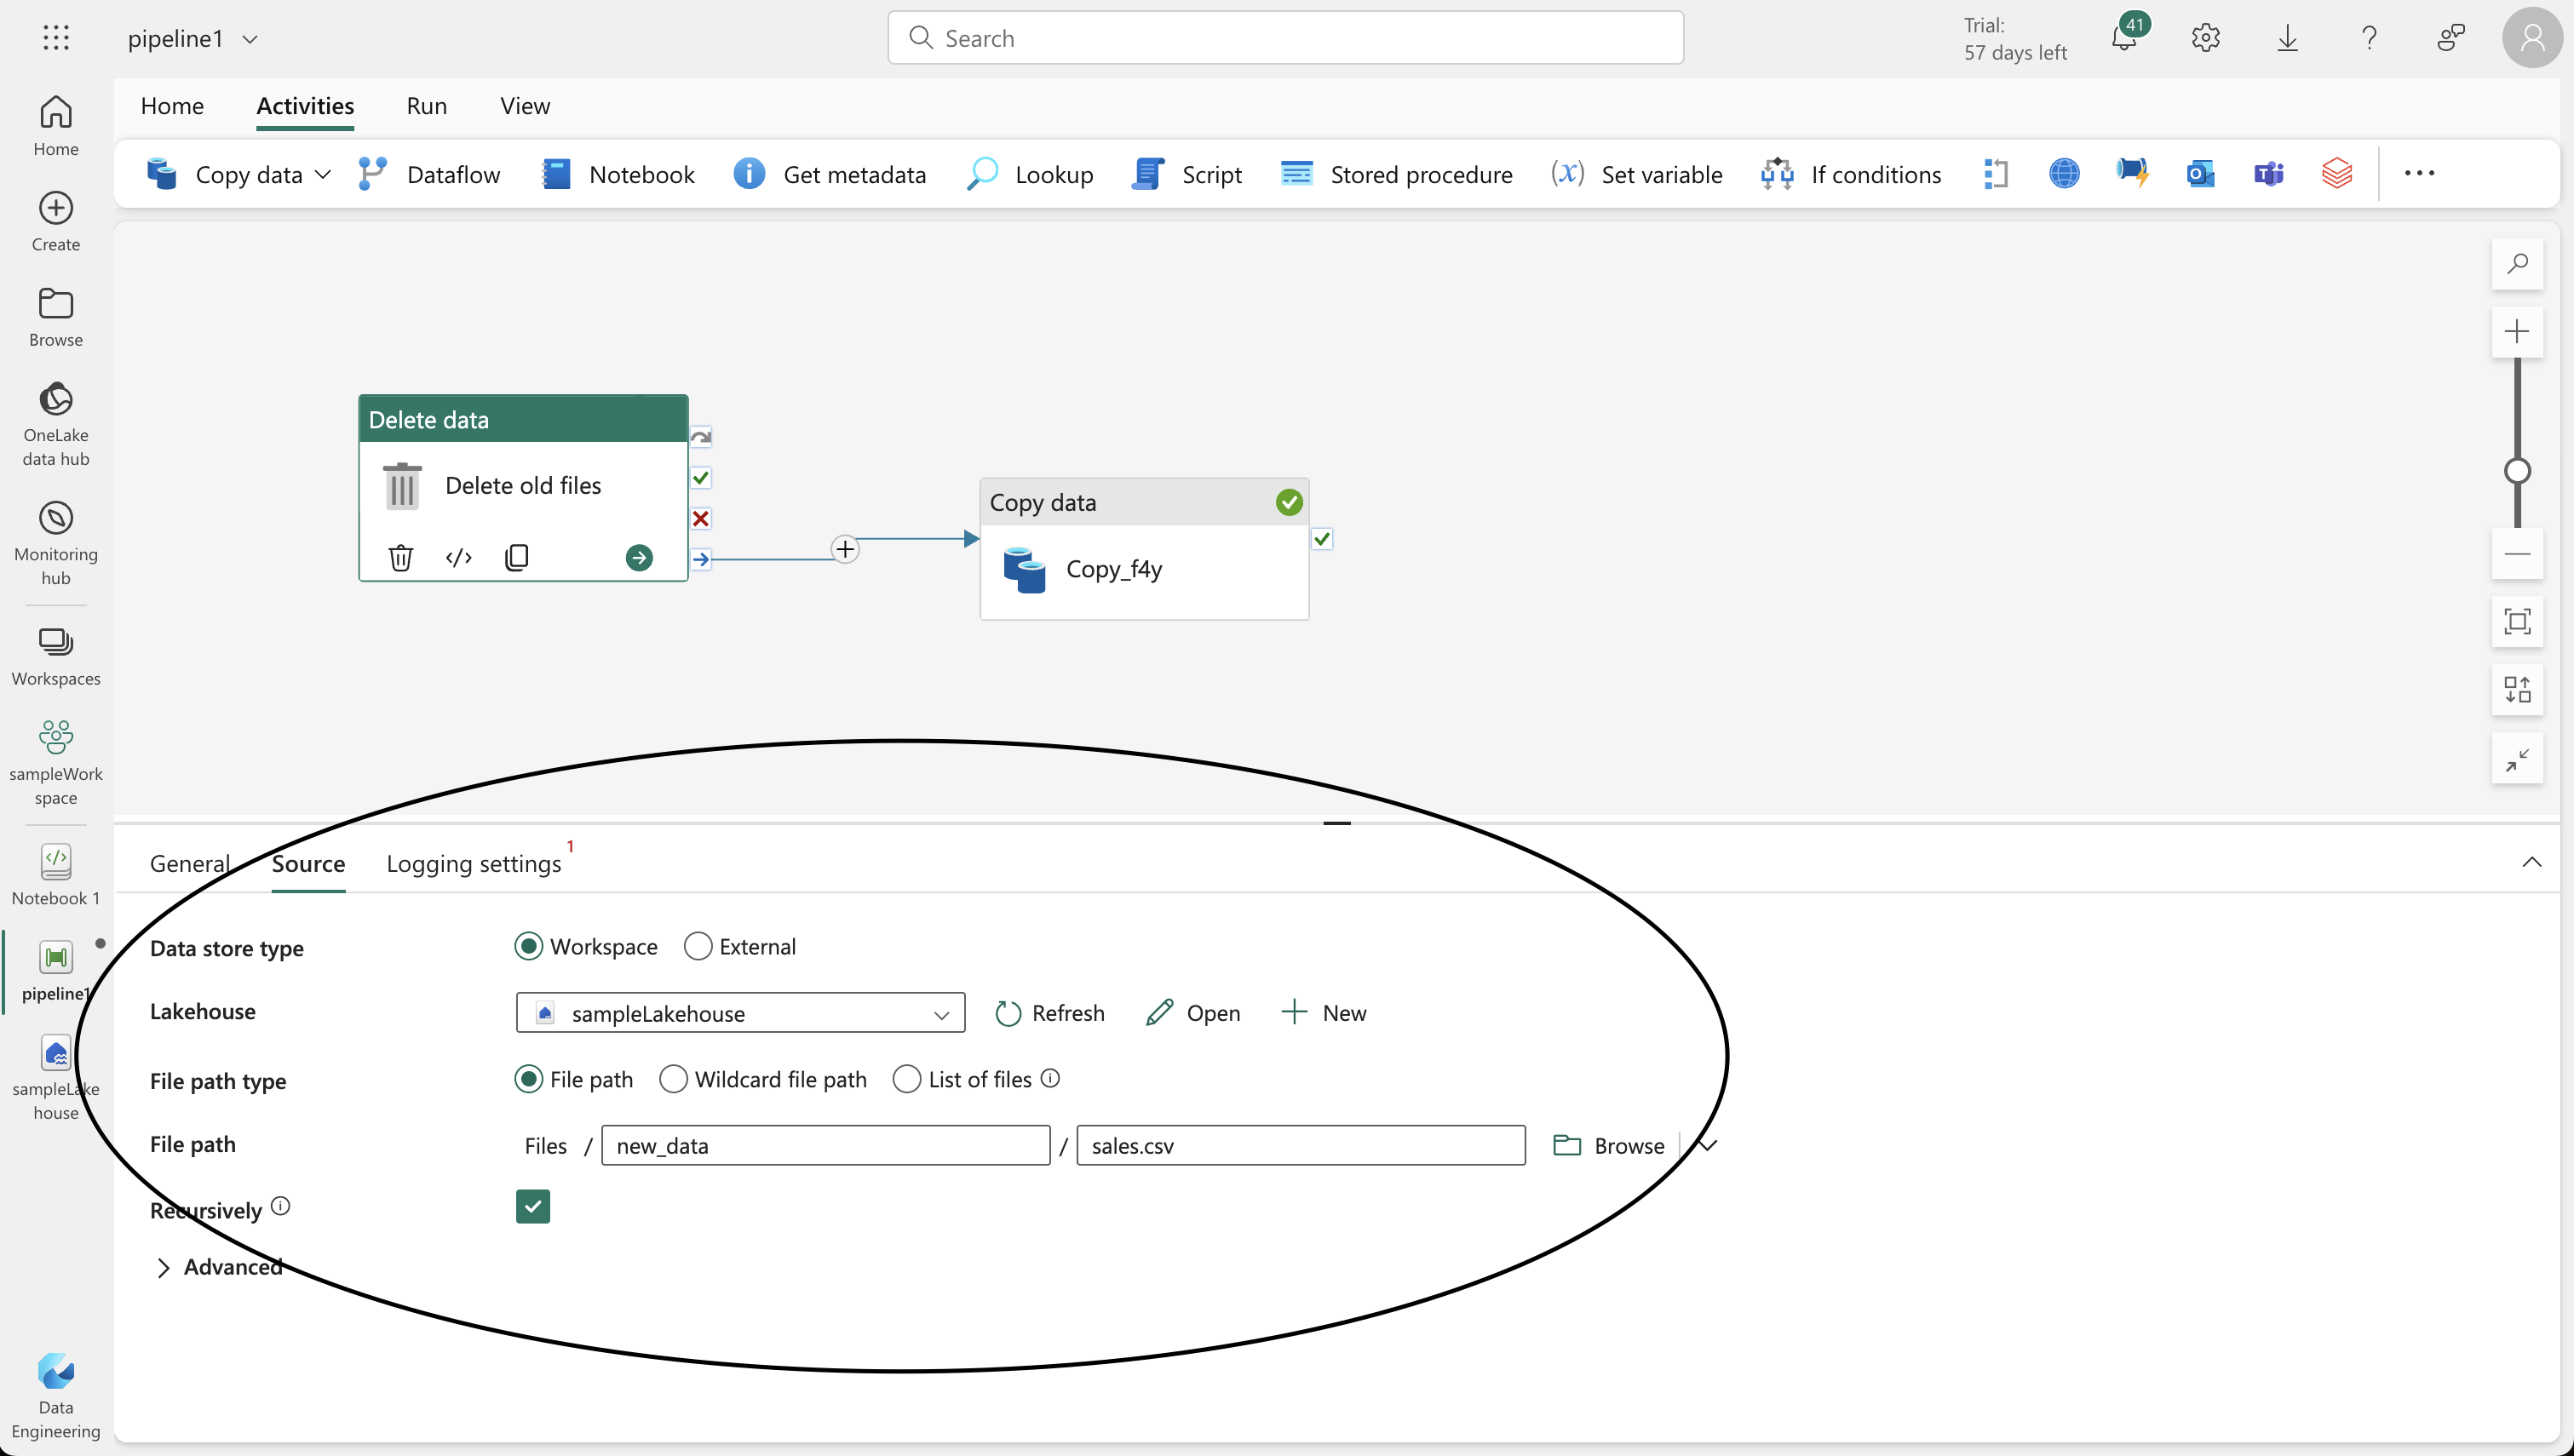
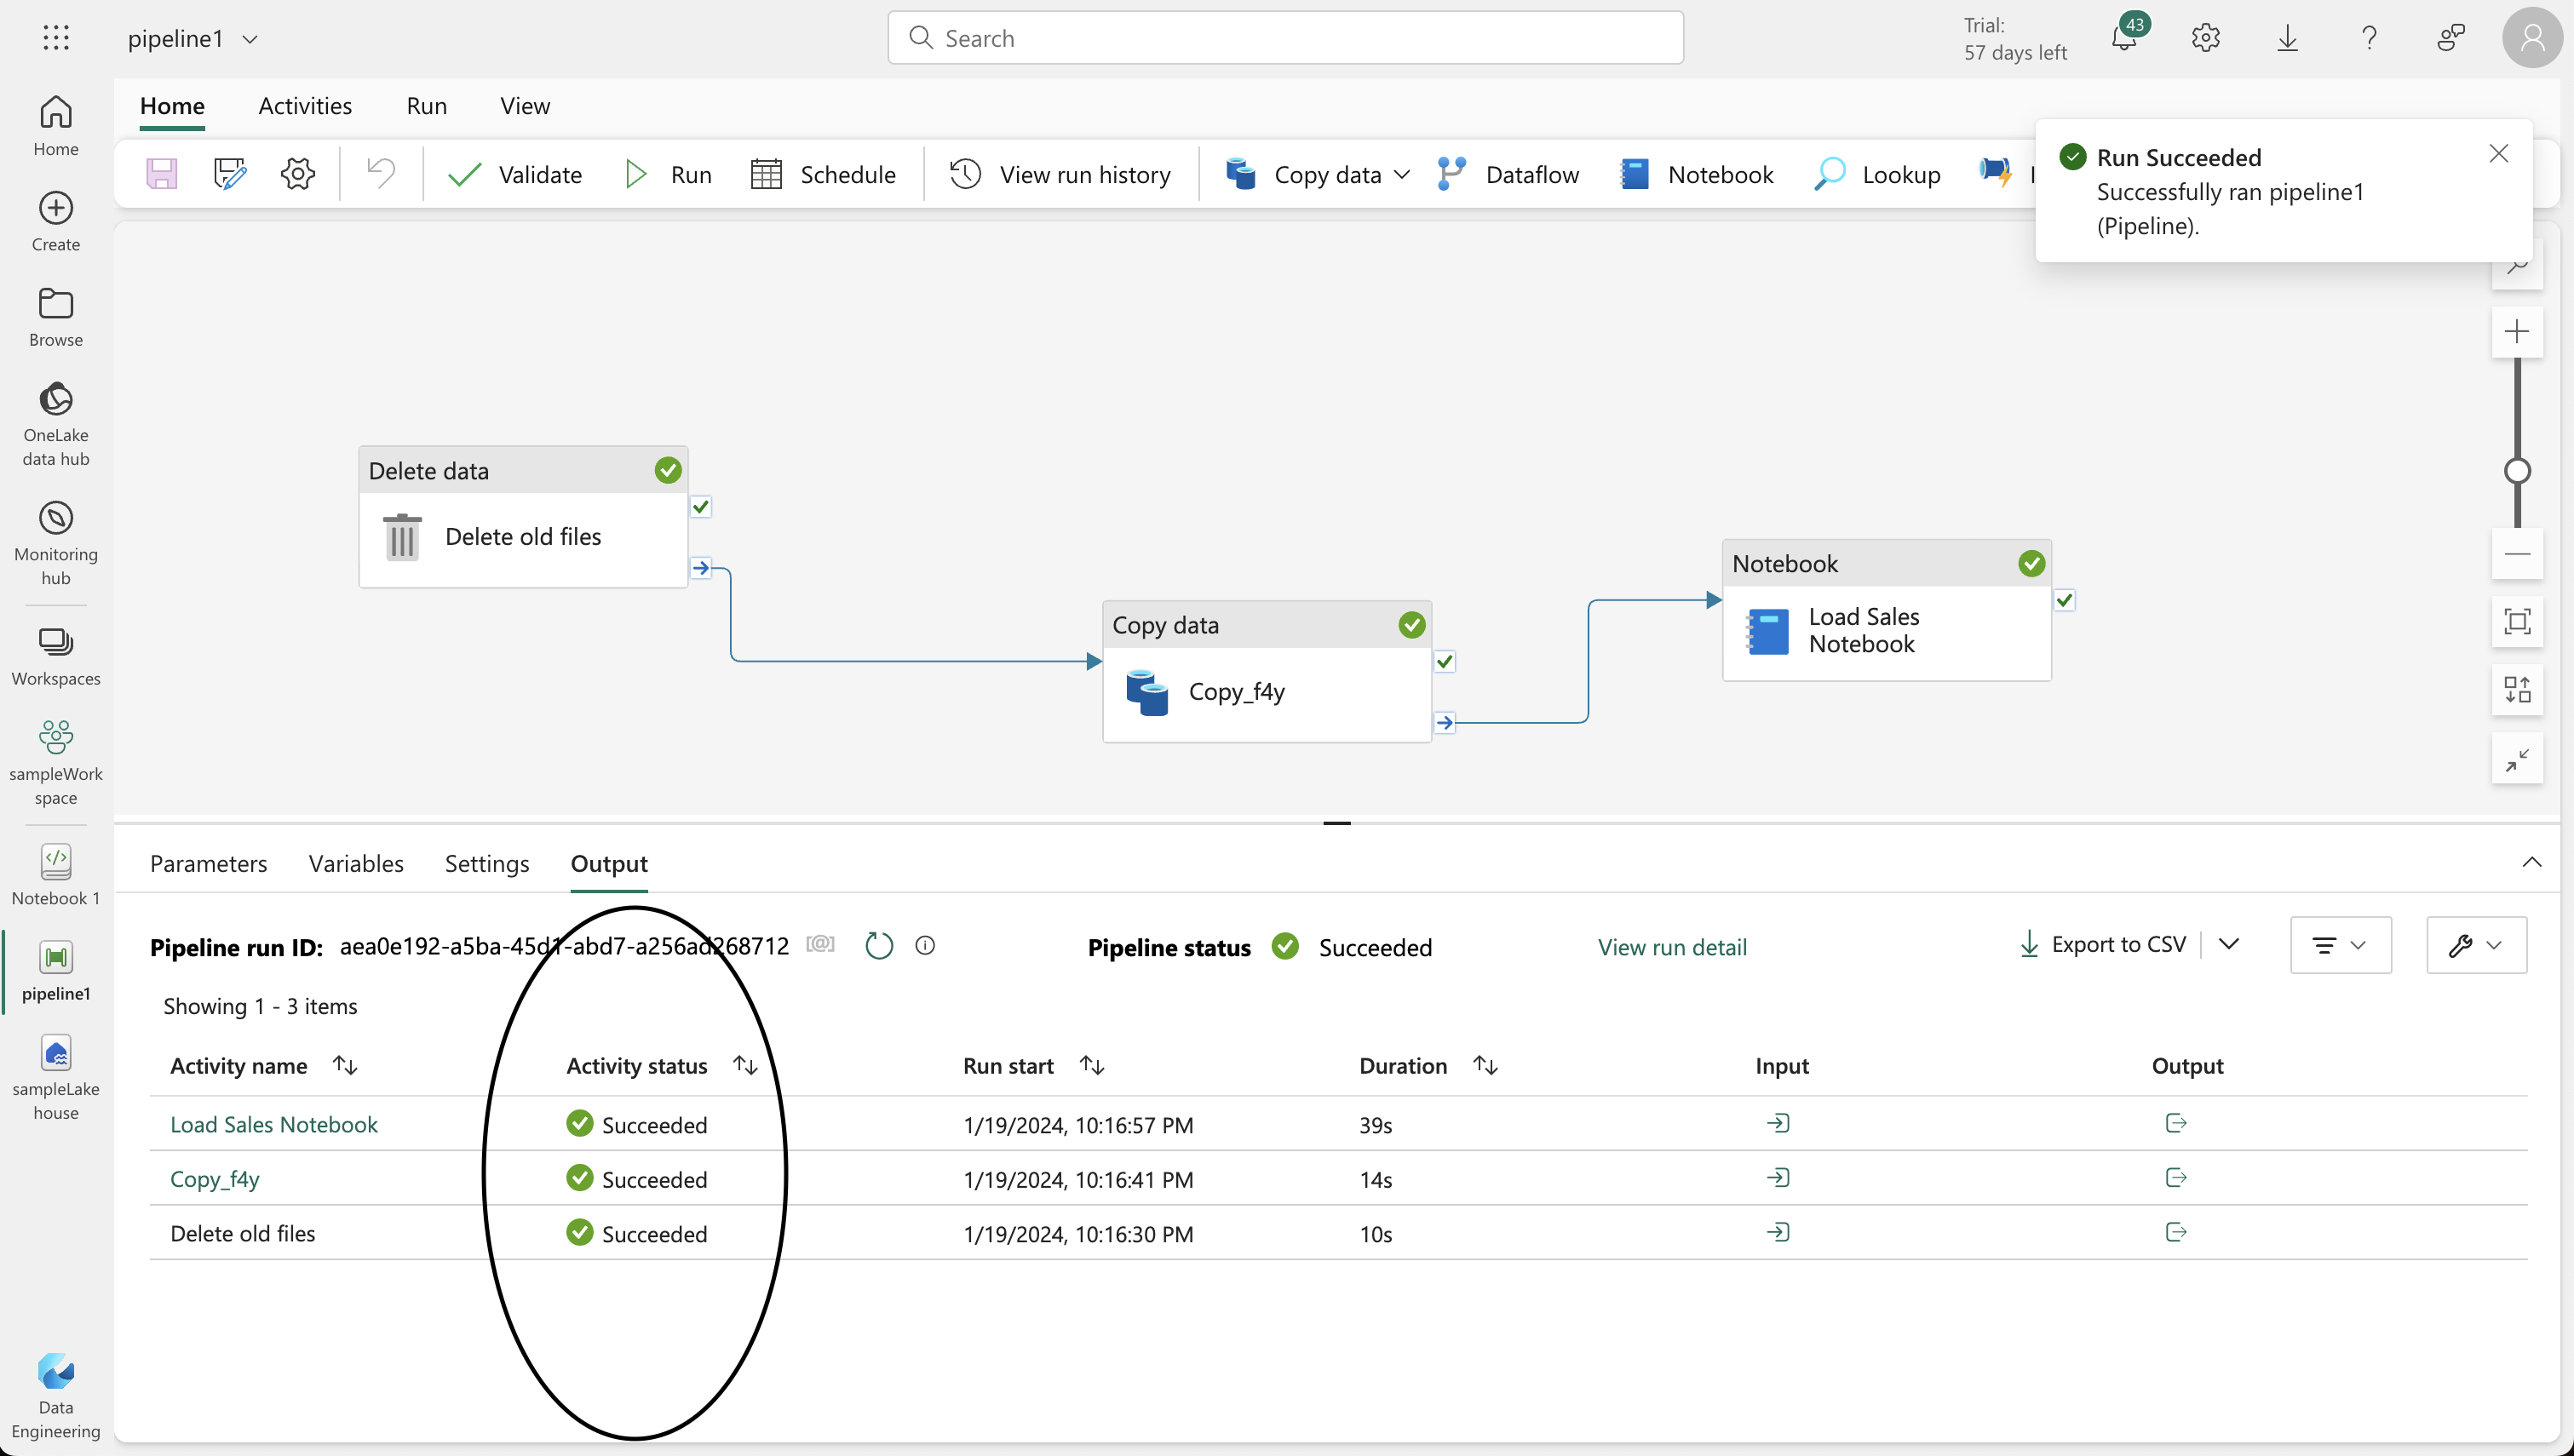
6. Modifying the Pipeline
- Incorporate the notebook into your pipeline for a reusable ETL (Extract, Transform, Load) process.
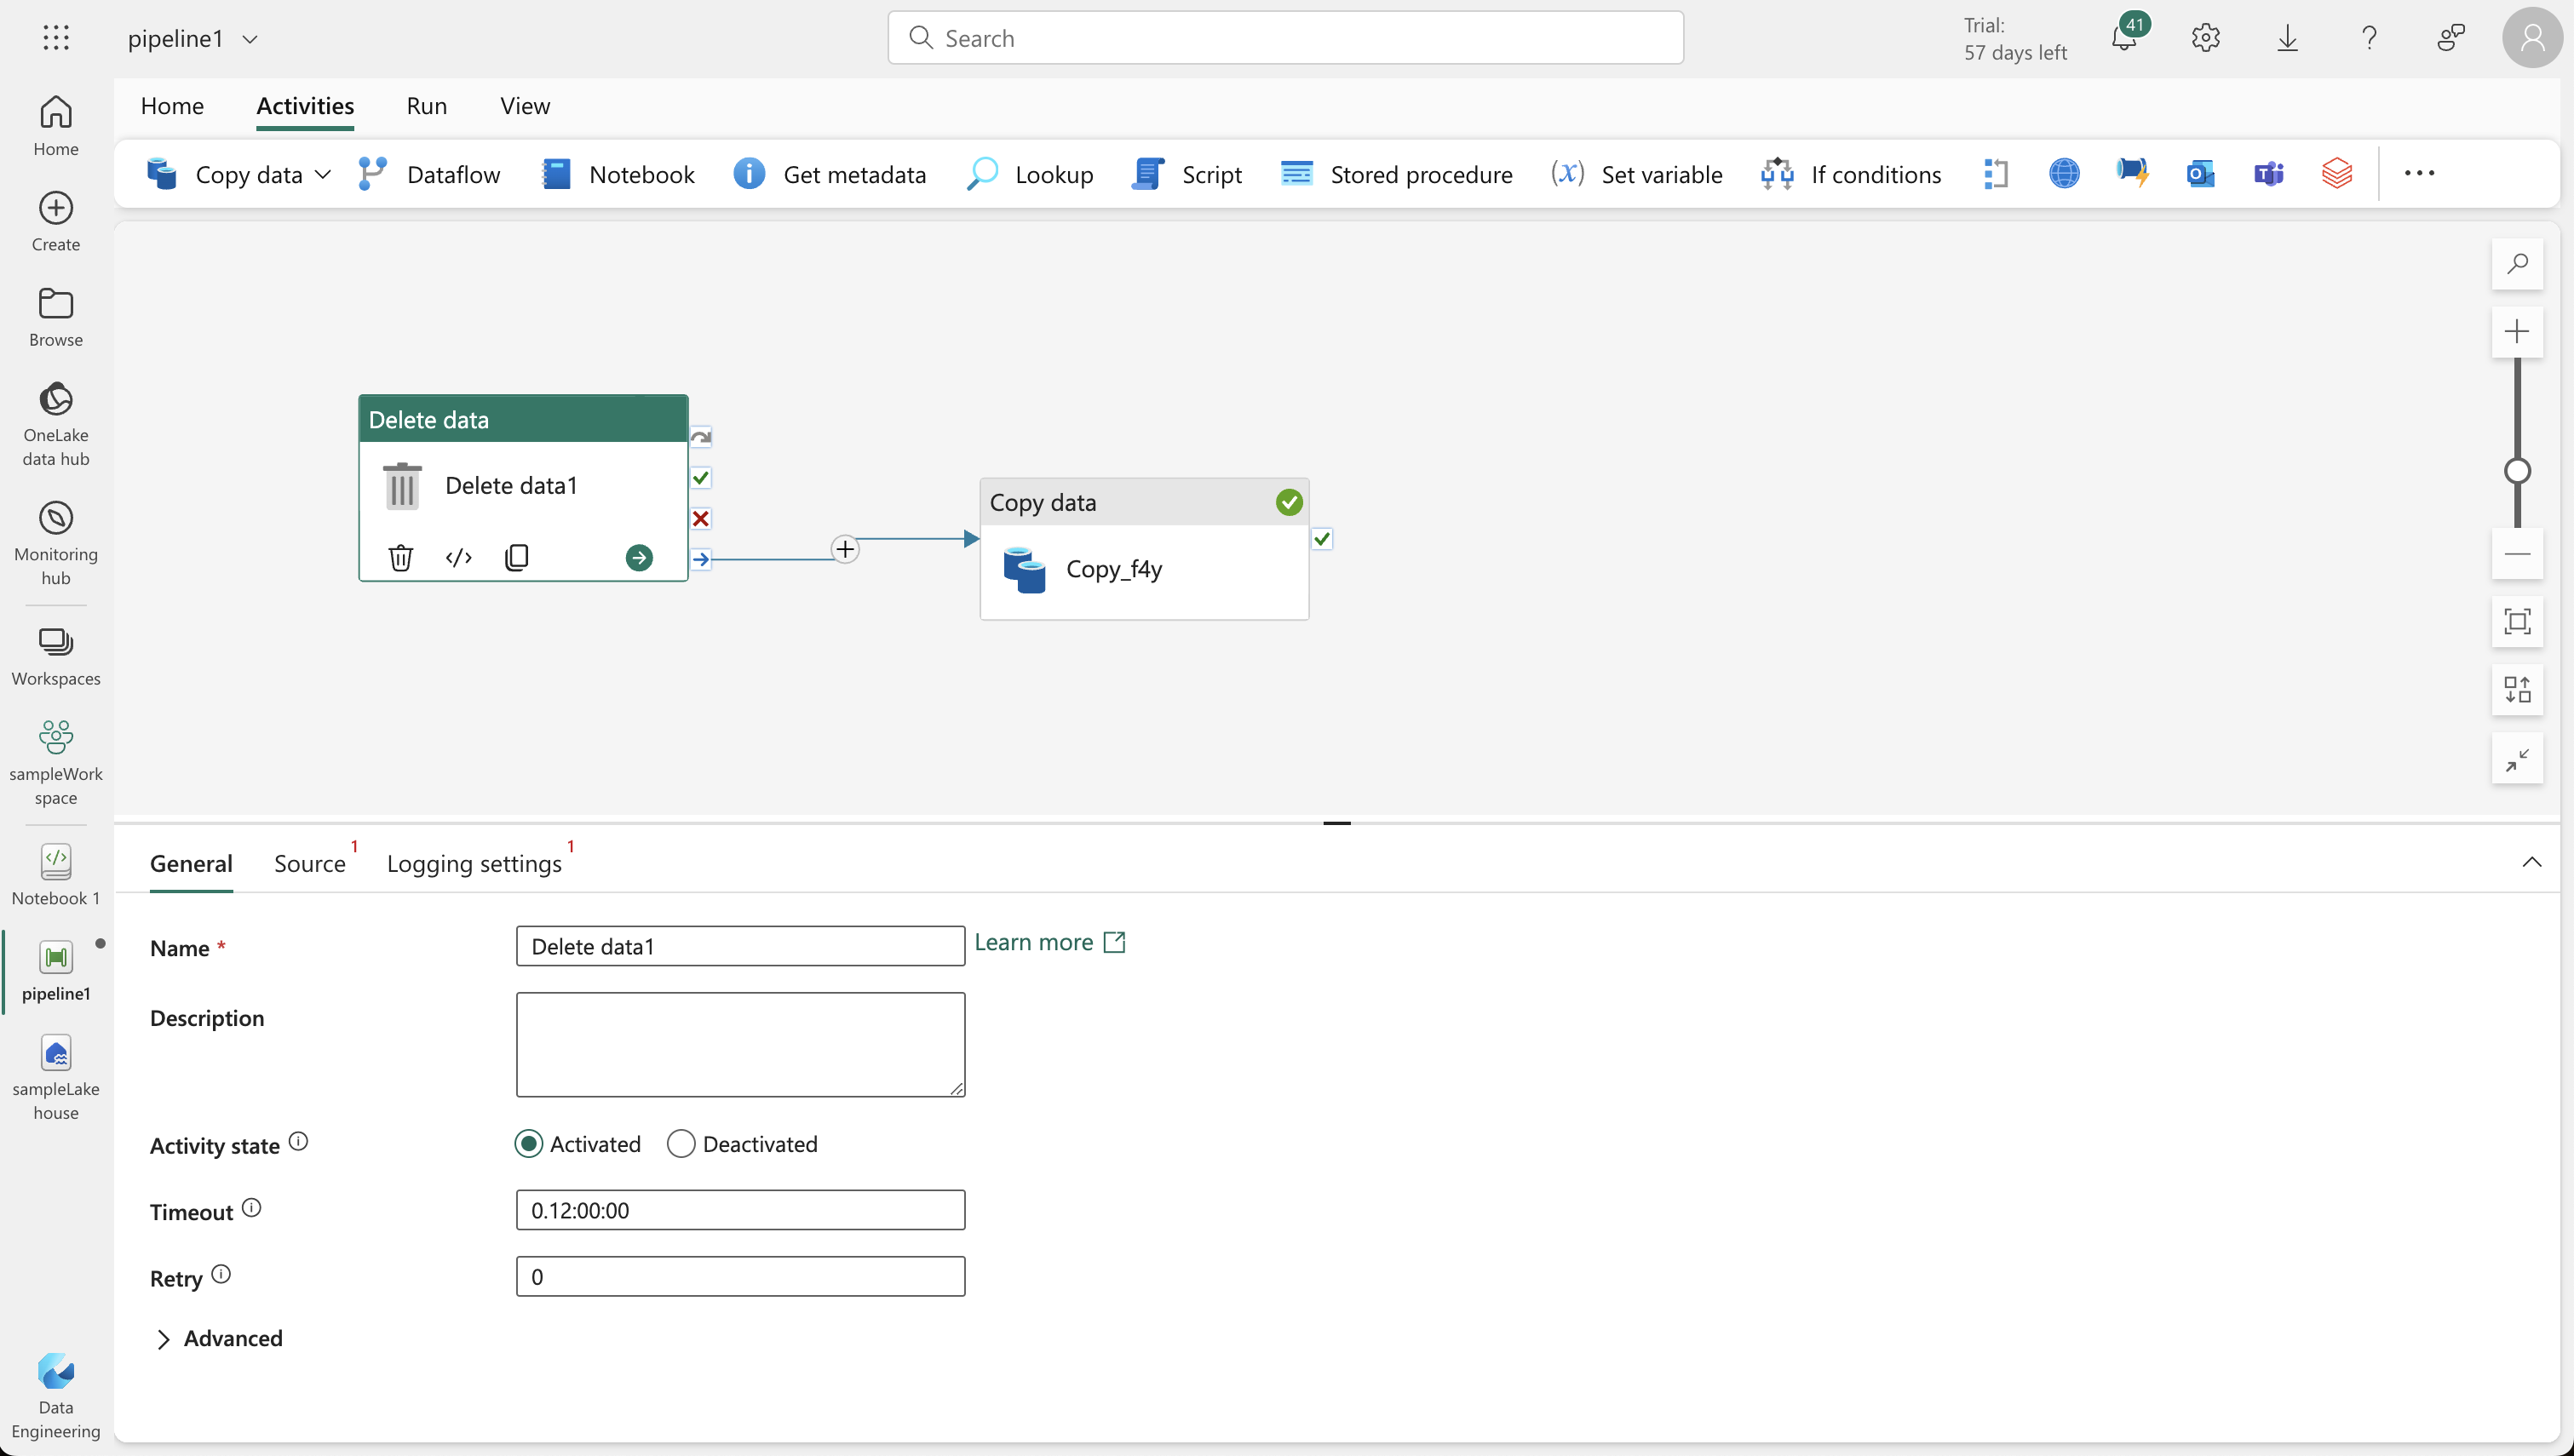
- Add a “Delete data” activity to remove existing .csv files before the new copy, and connect it to the “Copy data” activity.
- Add a “Notebook” activity after the “Copy data” activity, set to execute the “Load Sales” notebook.
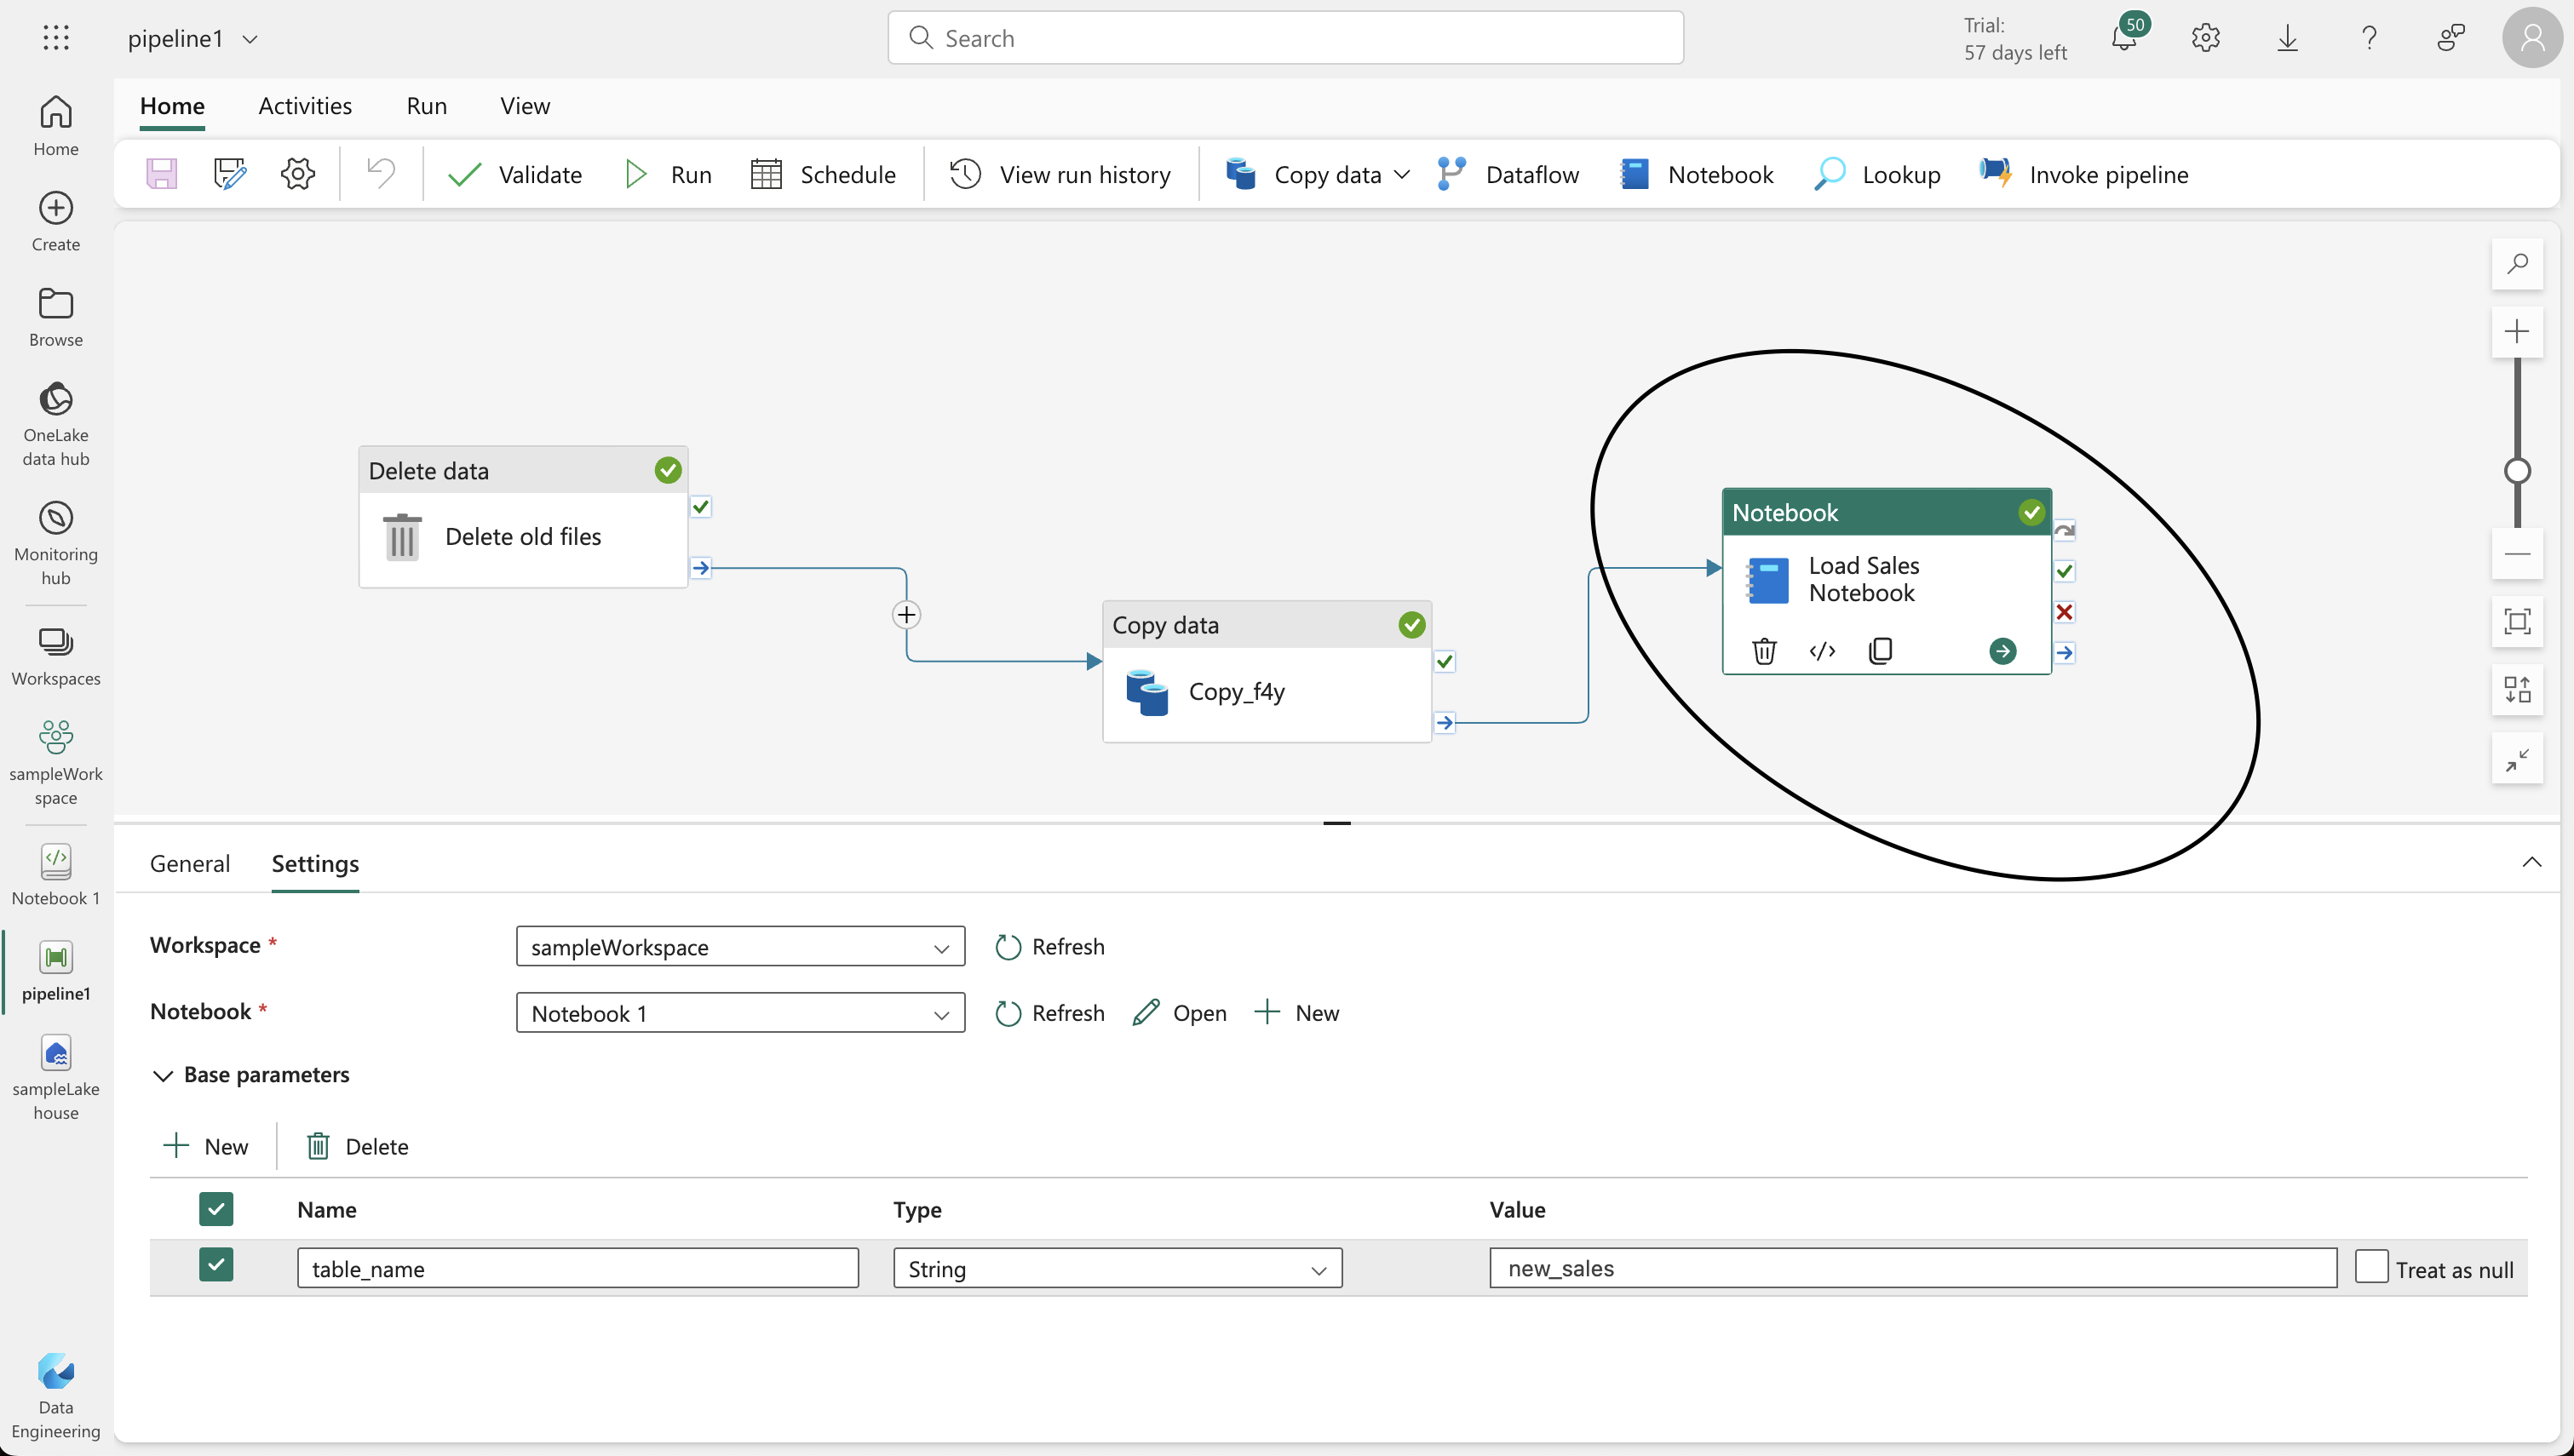
- Save and run the pipeline, ensuring all activities complete successfully.
7. Final Verification
- In your lakehouse, verify the creation of the “new_sales” table with the transformed data.