Optimization in PowerBI
Welcome to the Microsoft PowerBI Certification Series! Discover the world of data analytics and business intelligence with our comprehensive series. Learn about Power BI, data analysis processes, roles in data management, and gain insights into using Power BI effectively.


Optimization in Power BI
Performance optimization in Power BI is crucial for improving the efficiency of semantic models, particularly in real-world production environments. The performance optimization process involves minimizing the size of the semantic model and considering various factors. Key steps include:
- Use the right data types.
- Remove unnecessary columns and rows.
- Avoid duplicate values.
- Replace numeric columns with measures.
- Reduce cardinality.
- Analyze model metadata.
- Summarize data where possible.
By applying these strategies, you can enhance report loading speed, refresh times, and overall user experience. This approach is especially important in growing organizations with increasingly complex data models.
Identifying Performance Bottlenecks
Ensuring optimal performance in Power BI reports is crucial, particularly when dealing with complex models featuring multiple tables, intricate calculations, and various visuals. Poor performance can lead to a negative user experience. Identifying and resolving performance bottlenecks is key to enhancing overall efficiency.
Identifying Performance Bottlenecks:
- Semantic Model Efficiency: Start by ensuring your semantic model is efficient, with fast queries and measures. Identify and prioritize bottlenecks in your model.
- Review Measures and Queries: Examine the efficiency of measures and queries in your model. Focus first on the slowest queries to improve performance.
Analyzing Performance:
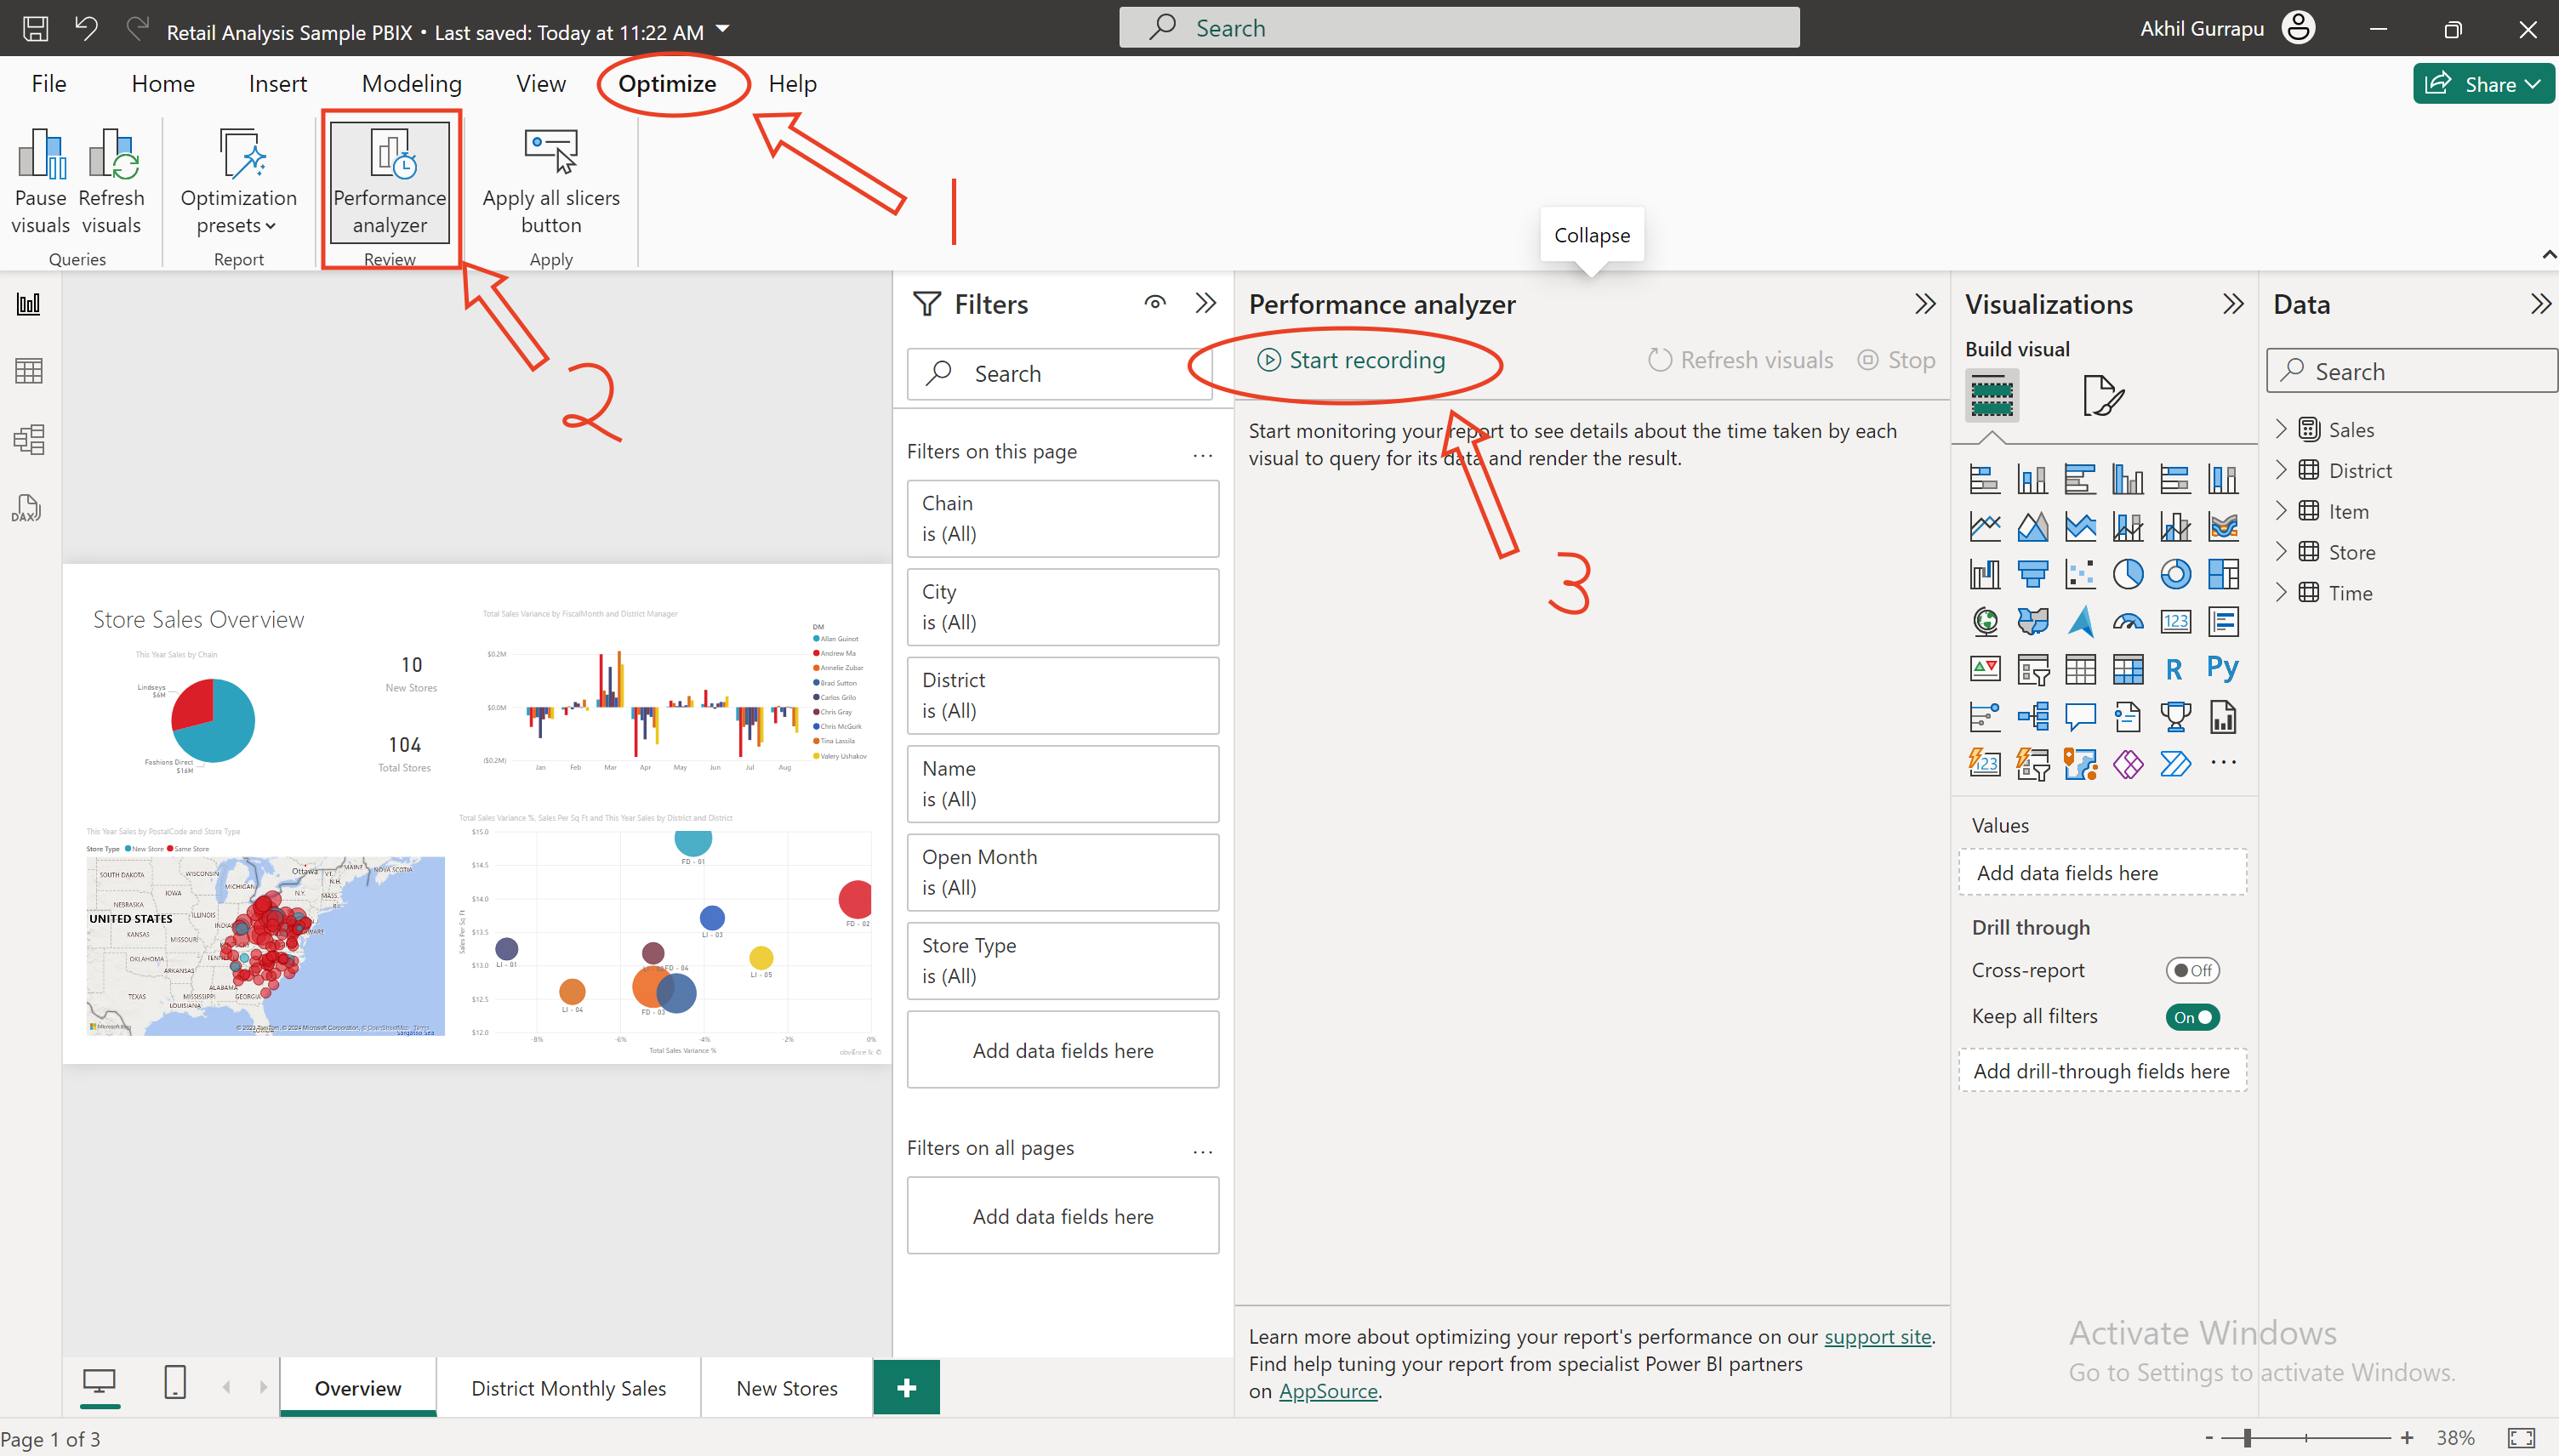
- Use Power BI Desktop’s Performance Analyzer to monitor the performance of report elements.
- Clear caches before analysis:
- Visual Cache: Ensure a clean visual cache by starting with a blank page in your Power BI Desktop file.
- Data Engine Cache: Clear the data cache by restarting Power BI Desktop or using DAX Studio.
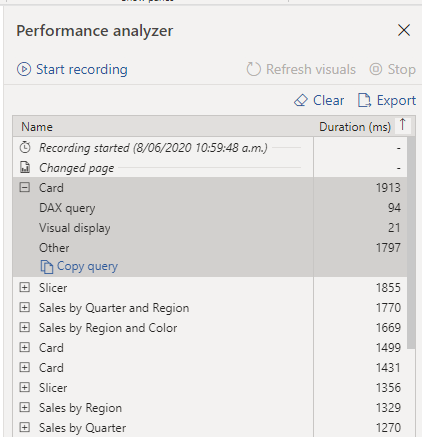
Reviewing Results:
- In Performance Analyzer, sort tasks by duration to identify which elements are taking the longest.
- Focus on three categories: DAX query duration, visual display time, and other processing tasks.
Optimizing Performance:
- Visuals:
- Reduce the number of visuals per page.
- Limit the number of fields in each visual; consider if each visual adds value.
- DAX Query:
- Analyze DAX queries taking longer than 120 milliseconds.
- Use tools like DAX Studio for detailed analysis and consider alternative functions for optimization.
- Semantic Model:
- Review relationships and ensure correct configuration.
- Remove redundant columns and metadata to streamline the model.
Additional Considerations:
- Data Reduction Techniques: Apply best practices for importing data, like avoiding unnecessary columns.
- Metadata Analysis: Use Power Query Editor to refine your data model.
- Evaluate Necessity of Columns: Use Power Query Editor to assess if each column is essential for your reports. Remove unnecessary columns to streamline your model.
- Check Data Types: Ensure that each column has the correct data type, adjusting as needed.
- Optimize Query Names: Rename queries for clarity and relevance.
- Analyze Column Details: Utilize Power Query Editor to examine:
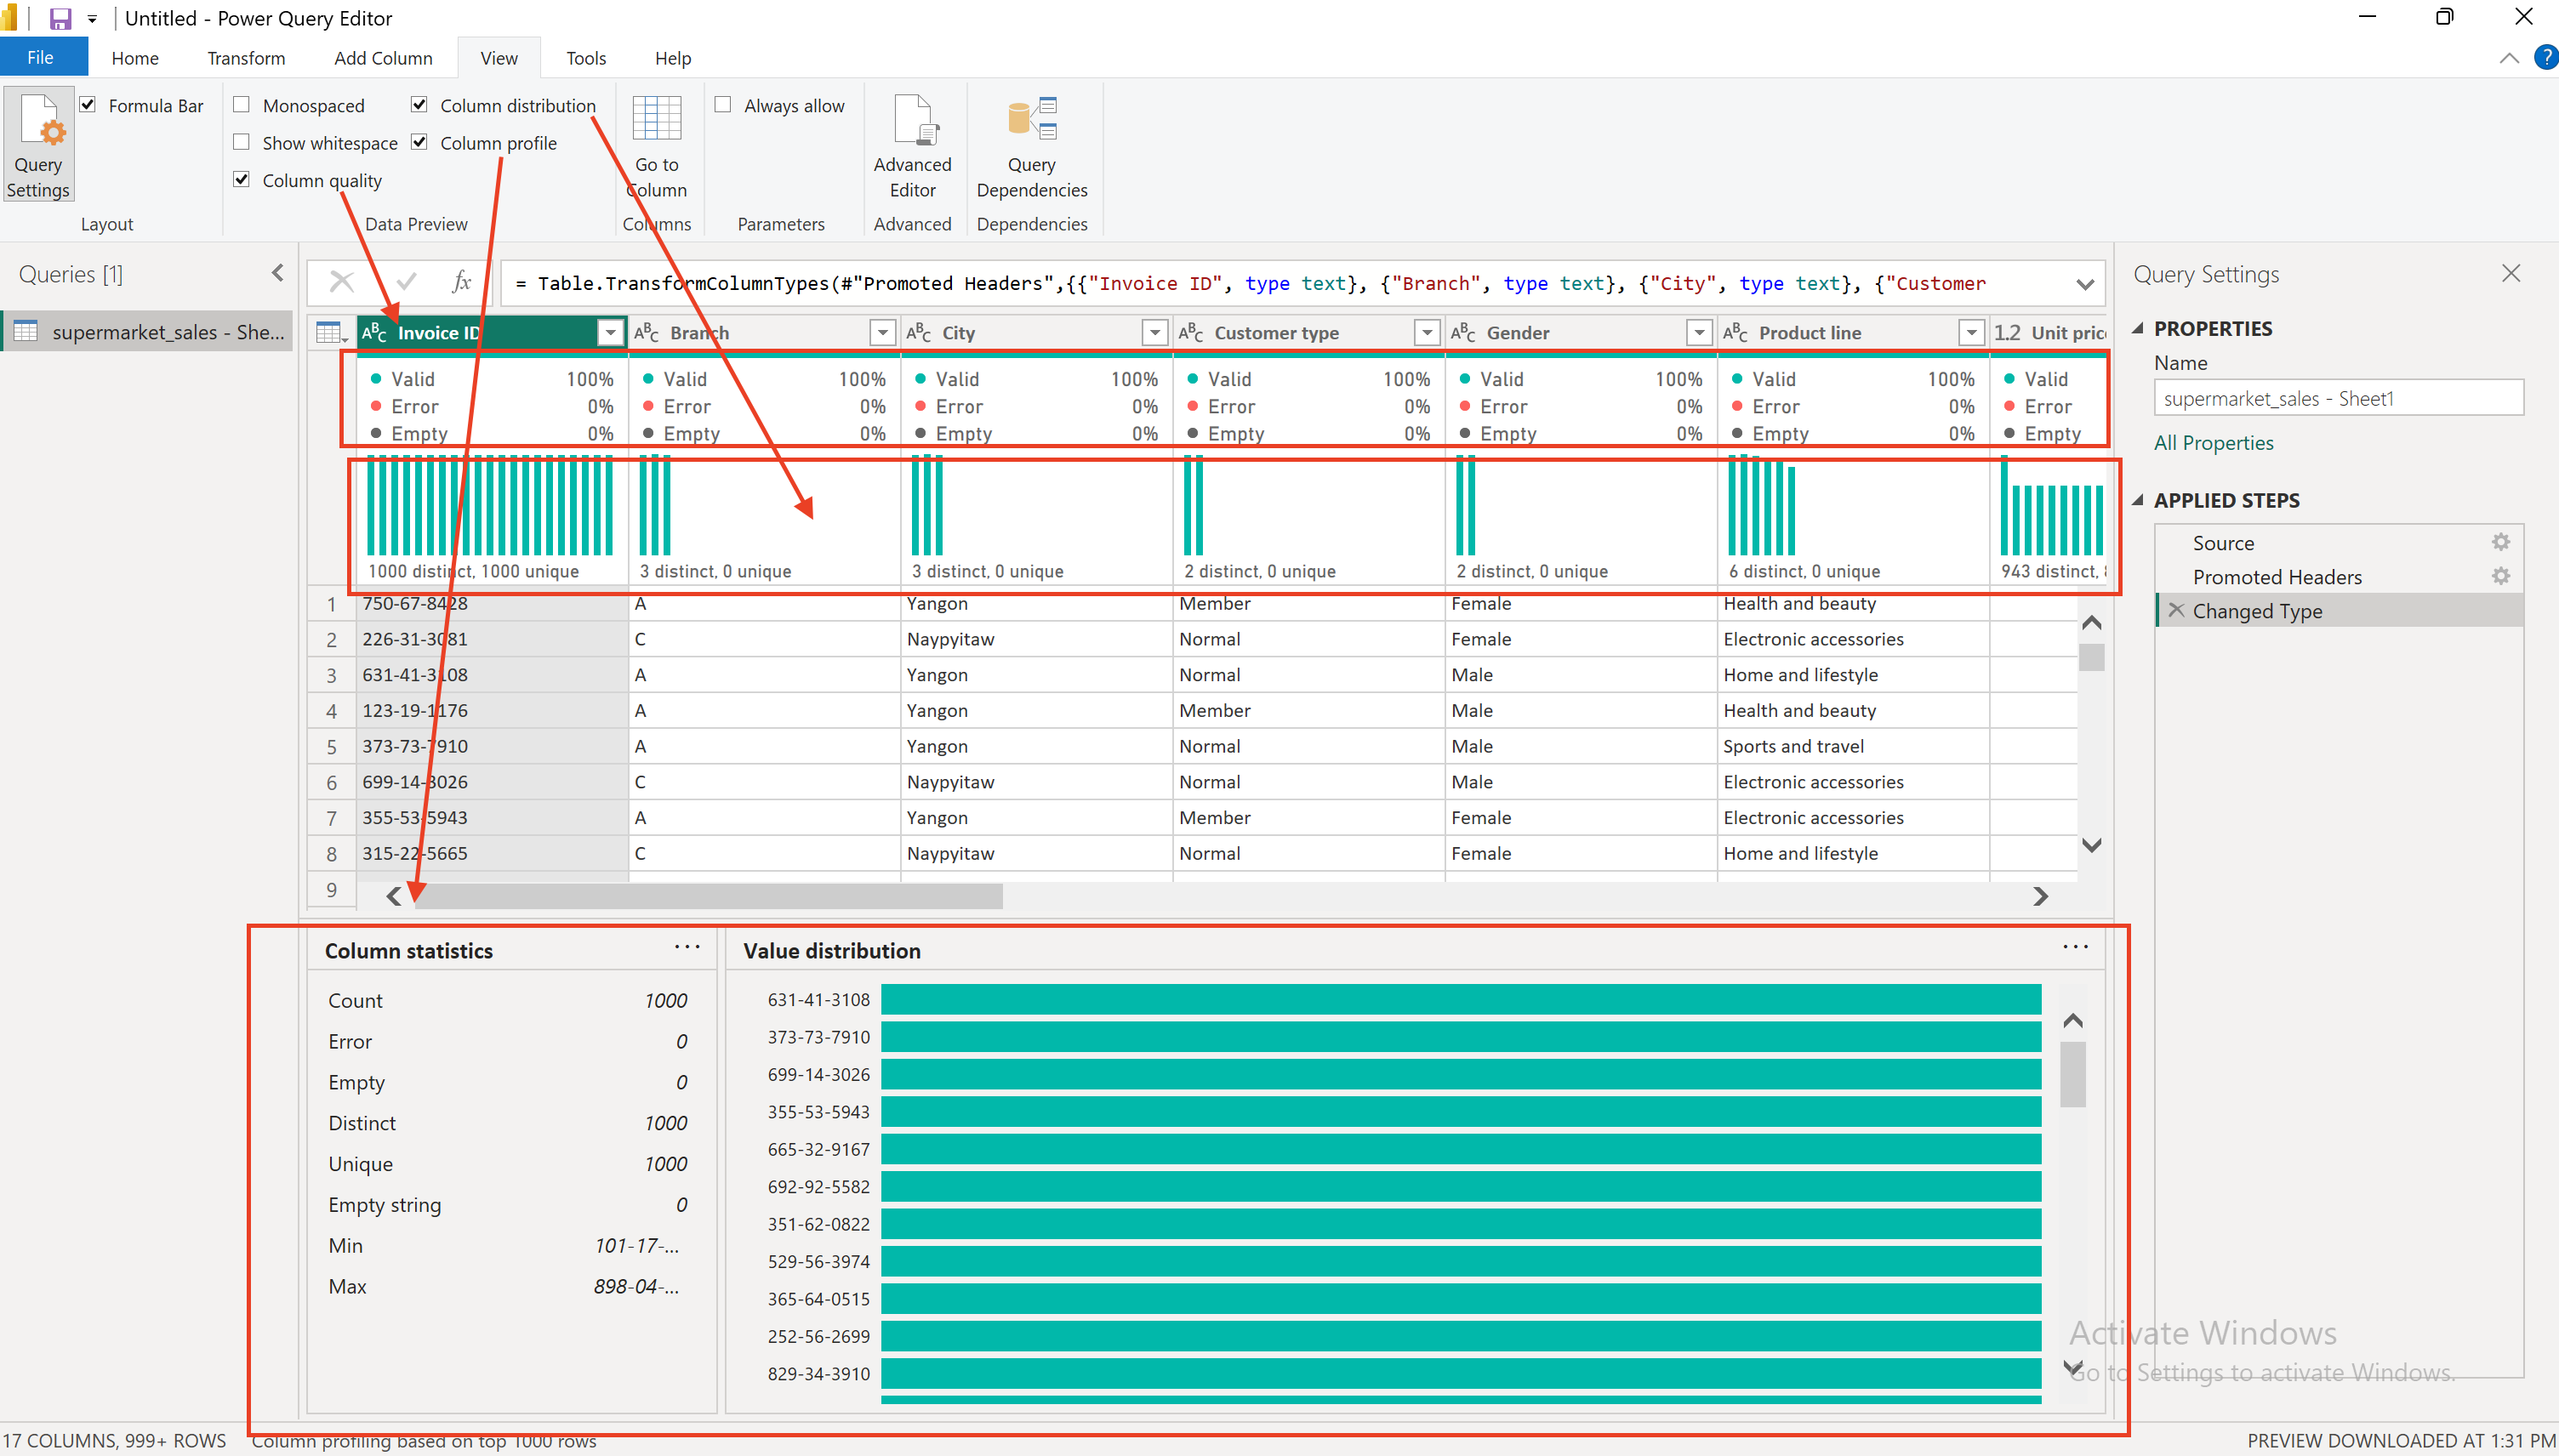
- Column Quality: Assess the validity of data in each column and correct any errors.
- Column Distribution: Review the distribution and frequency of values in each column.
- Column Profile: Analyze column statistics for deeper insights.
- Consider Entire Semantic Model: For large models, adjust settings in Power Query Editor to profile based on the entire data set, not just the top rows.
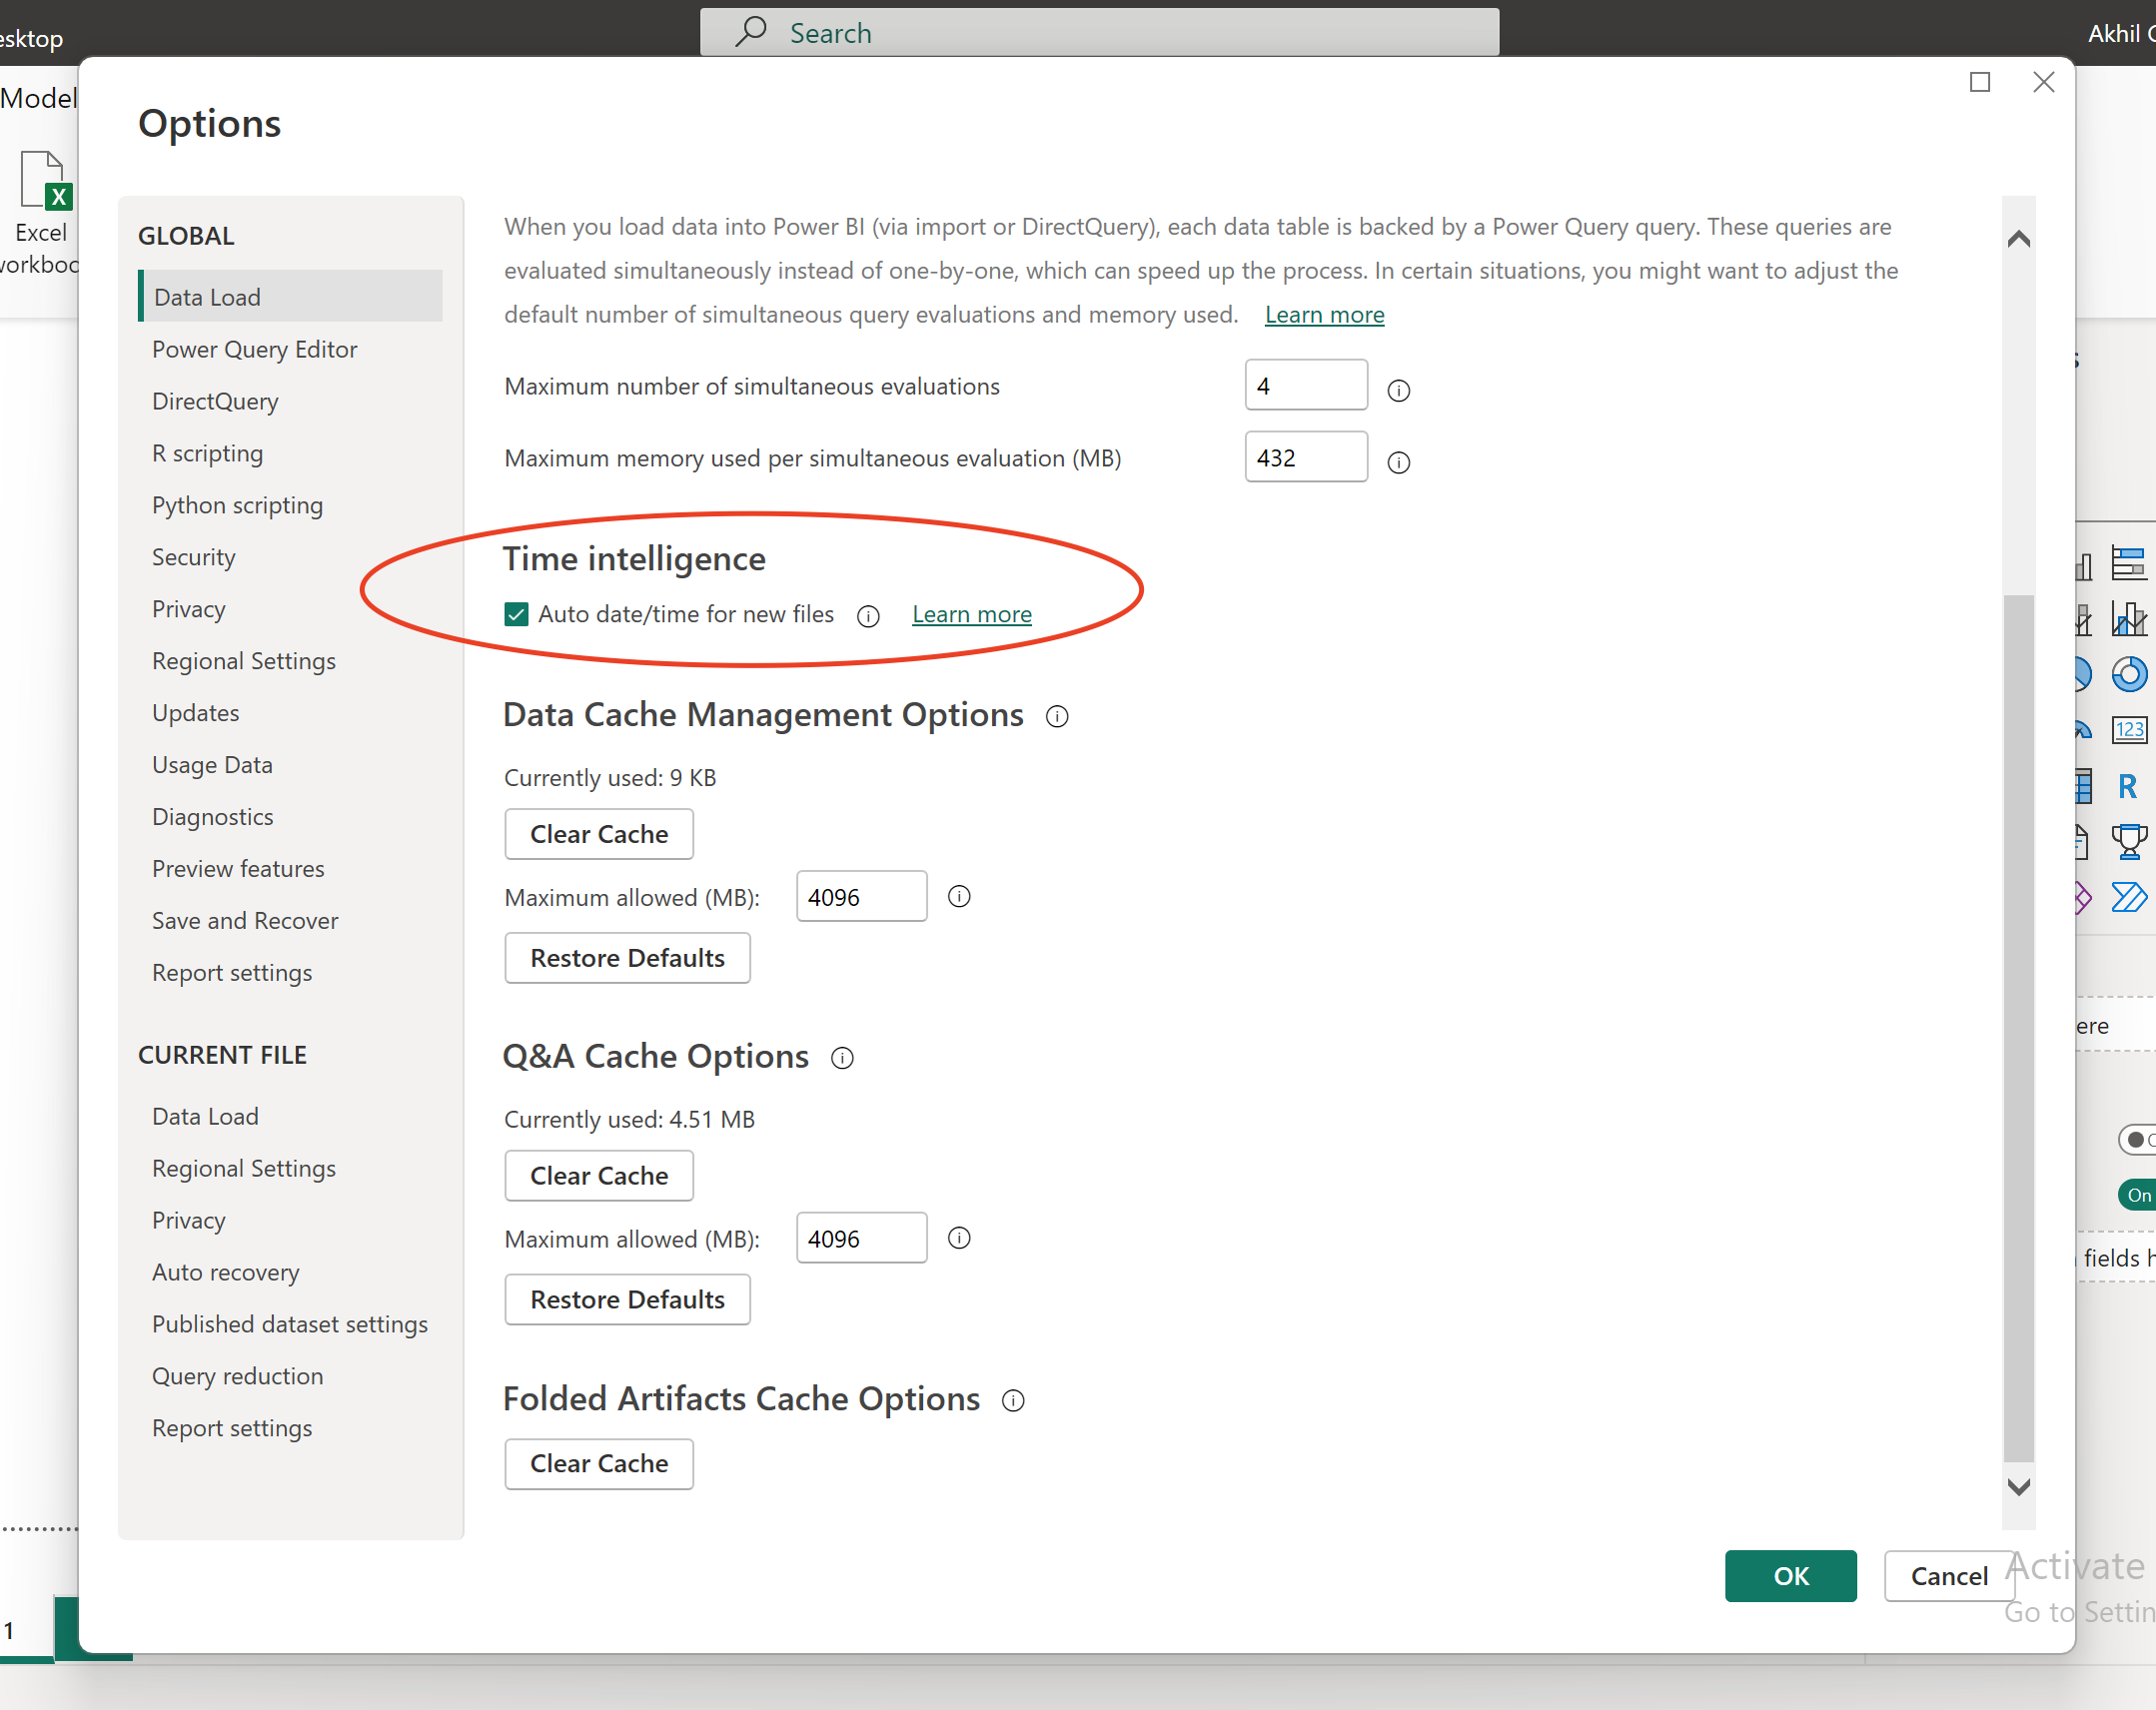
- Auto Date/Time Feature: Manage this feature based on your specific time-related requirements to optimize performance.
Use of Variables in DAX for Optimization
In Power BI Desktop, using variables in DAX formulas is a powerful technique. Variables simplify the creation of measures by reducing complexity and enhancing performance.
Example 1: Basic Sales Calculation
Without Variables:
Total Sales Difference = SUM(Sales[Amount]) - SUM(Sales[Amount Last Year])With Variables:
Total Sales Difference =
VAR CurrentYearSales = SUM(Sales[Amount])
VAR LastYearSales = SUM(Sales[Amount Last Year])
RETURN CurrentYearSales – LastYearSales
Benefits of Using Variables
Here, we calculate CurrentYearSales and LastYearSales once each and then use these variables in the final calculation, which is more efficient.
- Performance: Reduces the number of times an expression is calculated, improving query performance.
- Readability: Makes the DAX formulas easier to read and understand.
- Debugging: Simplifies troubleshooting by allowing you to check the output of each variable separately.
Use of Cardinality for Optimization
Cardinality refers to the uniqueness of values in a column and influences relationships between tables in Power BI. Understanding cardinality helps optimize performance and data relationships.
Identifying Cardinality Levels:
- Power Query Editor in Power BI allows you to view column statistics, including distinct and unique value counts. A column with many repeated values has low cardinality, while one with many unique values has high cardinality. Lower cardinality is desirable for better performance.

Managing Relationship Cardinality:
- Power BI Desktop automates relationship creation between tables, crucial for accurate reporting. You can create or edit relationships, and Power BI Desktop will guess the best configuration.
Types of Relationships:
- Many-to-One (*:1): Common default type, where a value in one table corresponds to a single instance in another table.
- One-to-One (1:1): Each table has a unique instance of a value.
- One-to-Many (1:*): A single instance in one table corresponds to multiple instances in another.
- Many-to-Many (:): Allows for relationships without unique value requirements, useful in composite models.
Best Practices:
- Ensure matching data types for columns in a relationship.
- For example, integer data types perform better than text types.
Use of Aggregations in Power BI for Optimization
Aggregations in Power BI are a technique for summarizing data to optimize query performance and manage large datasets efficiently. By grouping data at a higher level (e.g., by date, customer, or product), aggregations reduce the size of tables in the semantic model, focusing on essential data while using fewer resources.
Why Use Aggregations for Optimization:
- Enhanced Performance with Big Data: Aggregations provide better query performance for large datasets by caching summarized data instead of detailed data.
- Faster Refresh Times: By reducing the cache size, aggregations speed up the data refresh process, making information available to users more quickly.
- Semantic Model Management: Aggregations are key in reducing and maintaining the size of large semantic models, especially important for models expected to grow.
Examples of Aggregations:
- In a scenario where a semantic model’s file size is too large, such as 1 GB, and needs reduction to 50 MB, creating aggregations for sales data can be a solution.
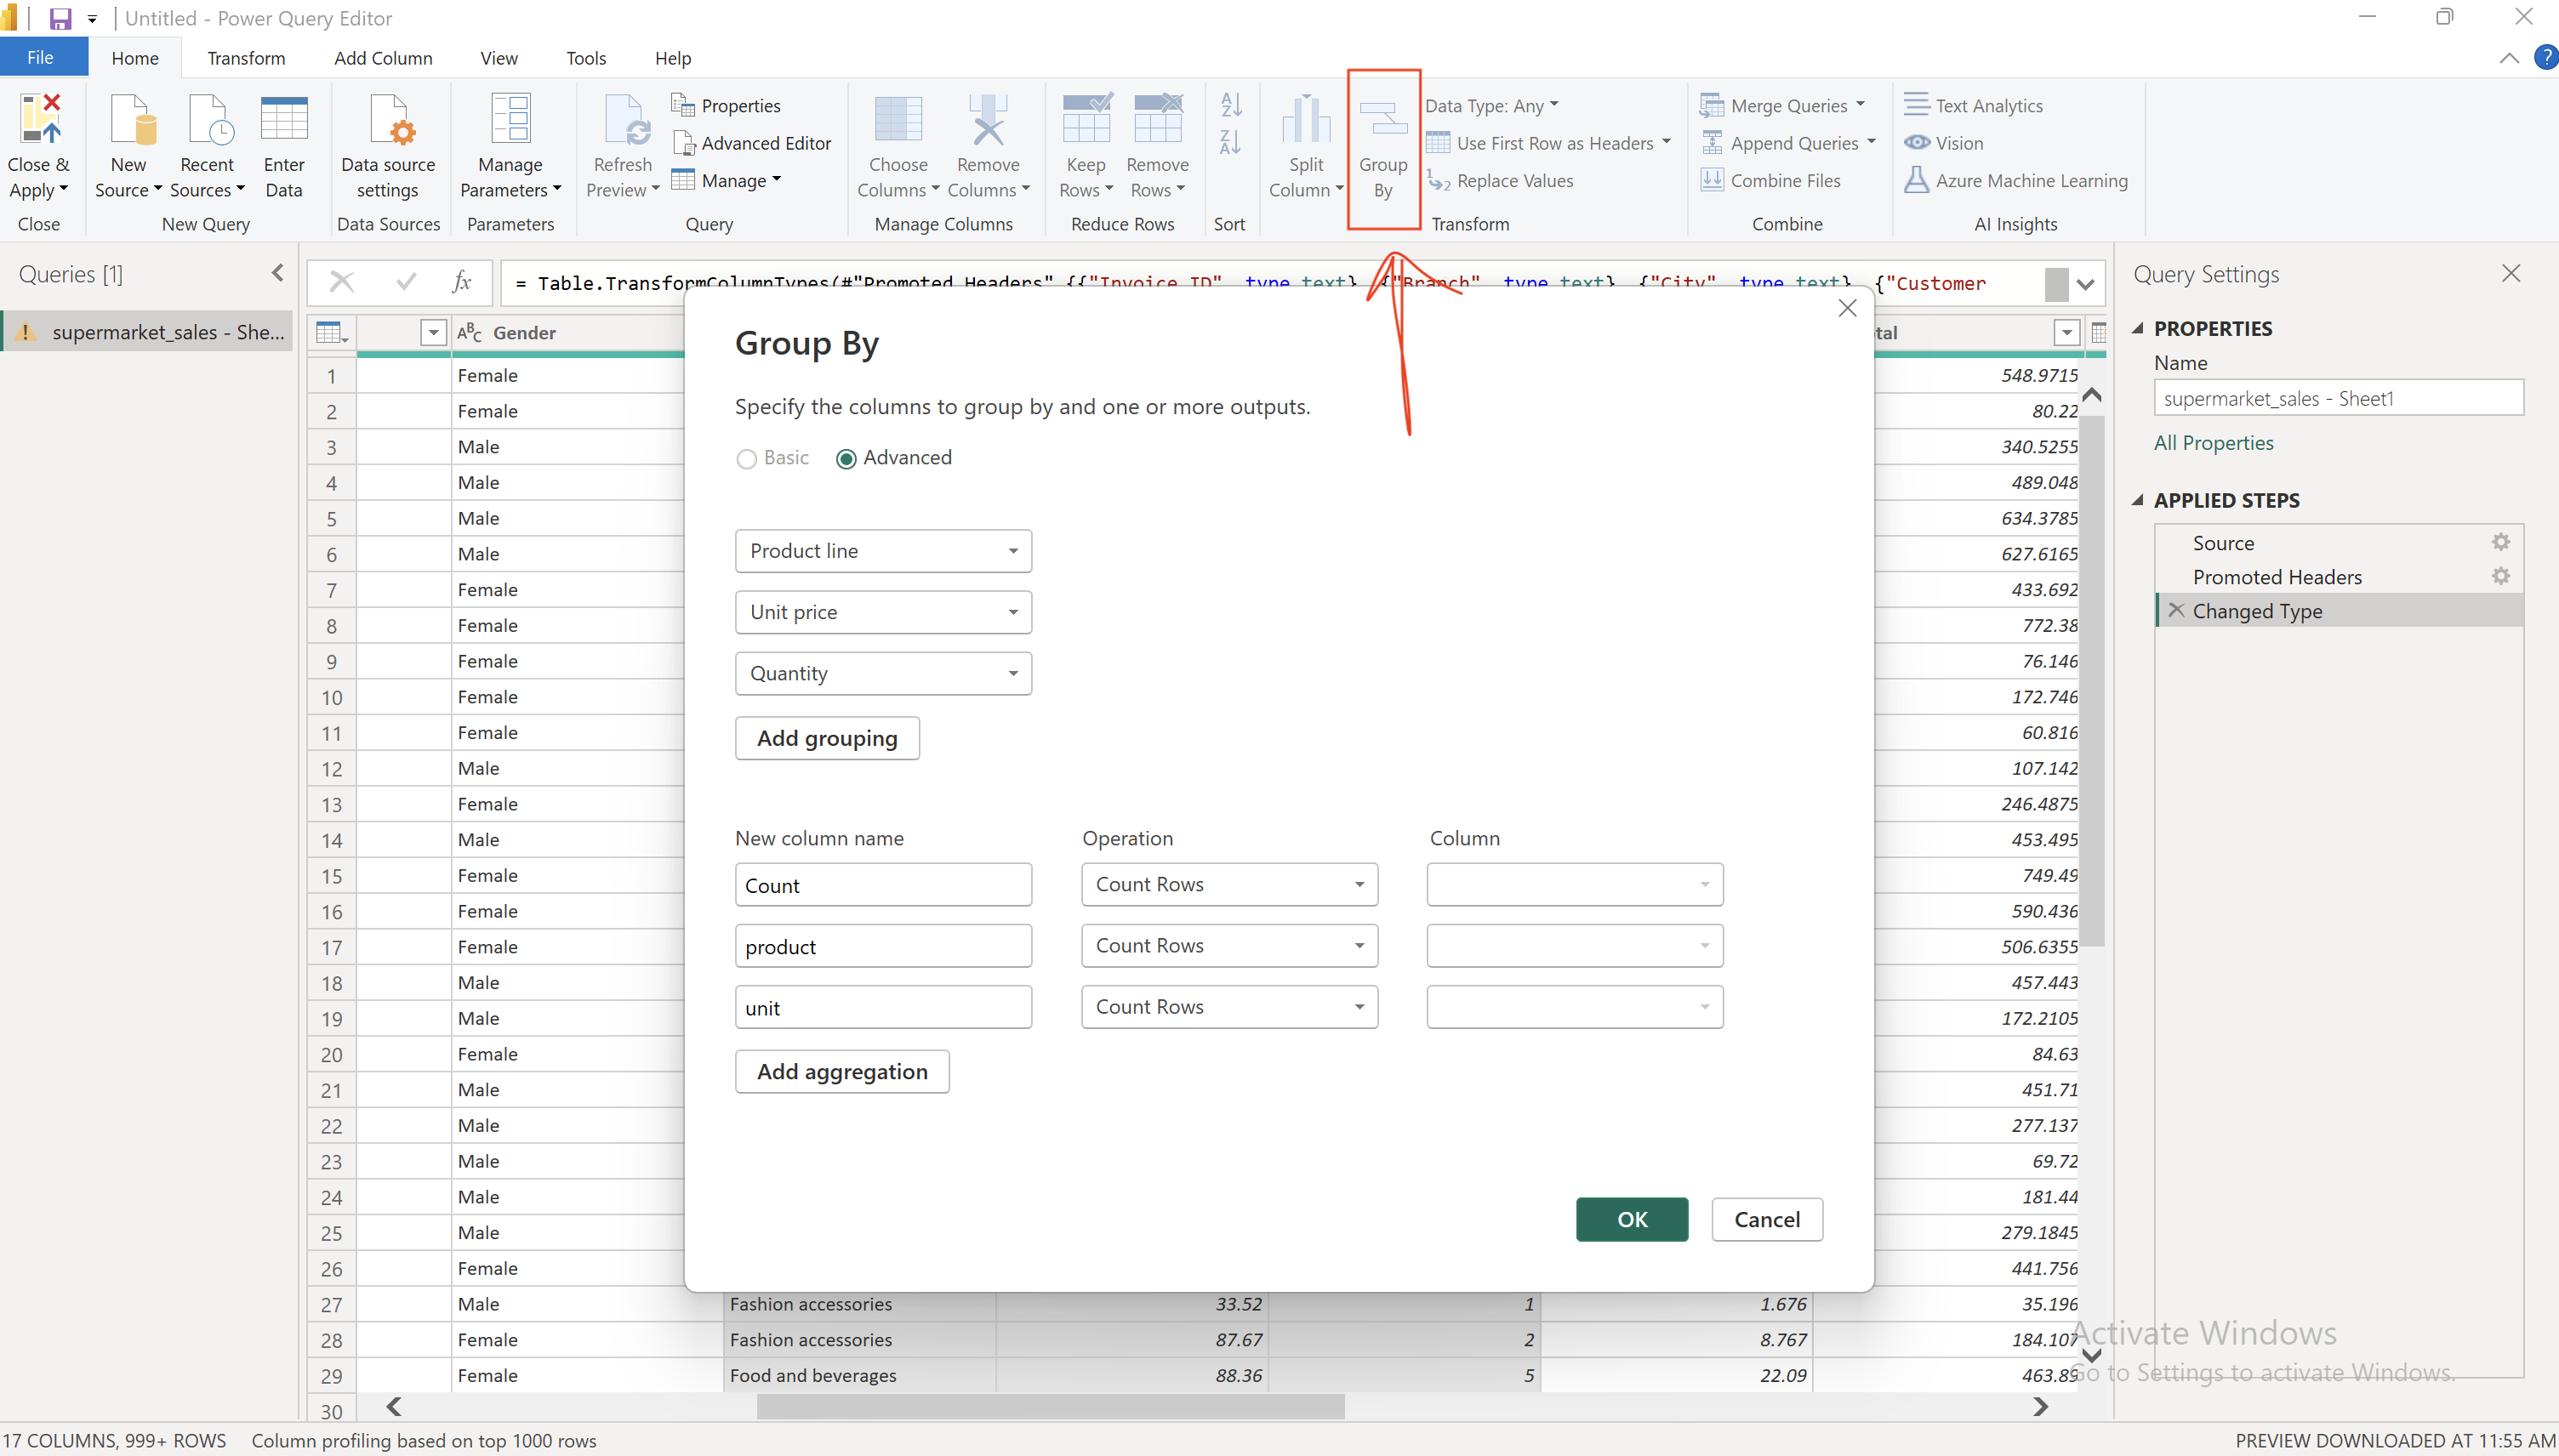
- By aggregating sales data at the day level, the number of data rows is significantly reduced. This is done by selecting relevant columns and using the “Group By” option in Power Query Editor within Power BI Desktop.
Aggregations in Power BI are crucial for handling big data efficiently, speeding up data refresh times, and maintaining large semantic models, ultimately leading to better overall performance and scalability of Power BI projects.
Optimizing DirectQuery in Power BI Desktop
DirectQuery allows Power BI Desktop to connect directly to data sources, offering real-time data access. However, its performance heavily depends on the data source’s efficiency, with challenges such as network latency and high user traffic potentially slowing down responses.
Optimization Strategies:
- Analyze and optimize source queries.
- Use Power BI Desktop’s Performance Analyzer to identify slow queries.
- Reduce visuals and streamline fields to minimize bottlenecks.
- Improve source database performance with indexing and optimizing calculated columns.
- Adjust Query Reduction Options in Power BI Desktop to limit query frequency.
Effective optimization of DirectQuery can lead to improved performance and user experience in Power BI Desktop.