Microsoft Fabric Lakehouse
Explore the innovative Microsoft Fabric Lakehouse, a powerful data management solution that combines the flexibility of a data lake with the analytical capabilities of a data warehouse. Learn how it simplifies data processing, offers versatile data storage, and enhances data governance for modern data-driven businesses. Discover its key components, tools, and benefits for efficient data analysis and reporting.

Power of Microsoft Fabric’s Lakehouse:
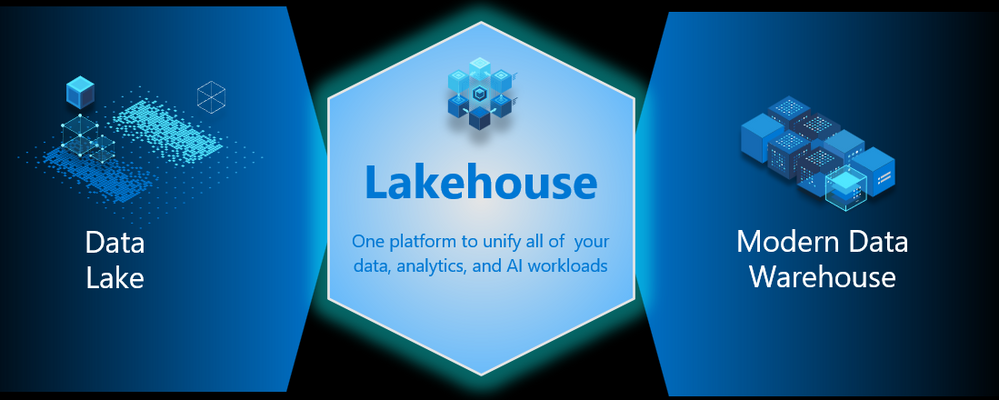
In the evolving world of data management, Microsoft Fabric is emerging as a groundbreaking solution with its innovative Lakehouse architecture. Built atop the robust OneLake storage layer, this platform ingeniously combines the expansive storage capabilities of a data lake with the precision and analysis prowess of a data warehouse.
Key Features:
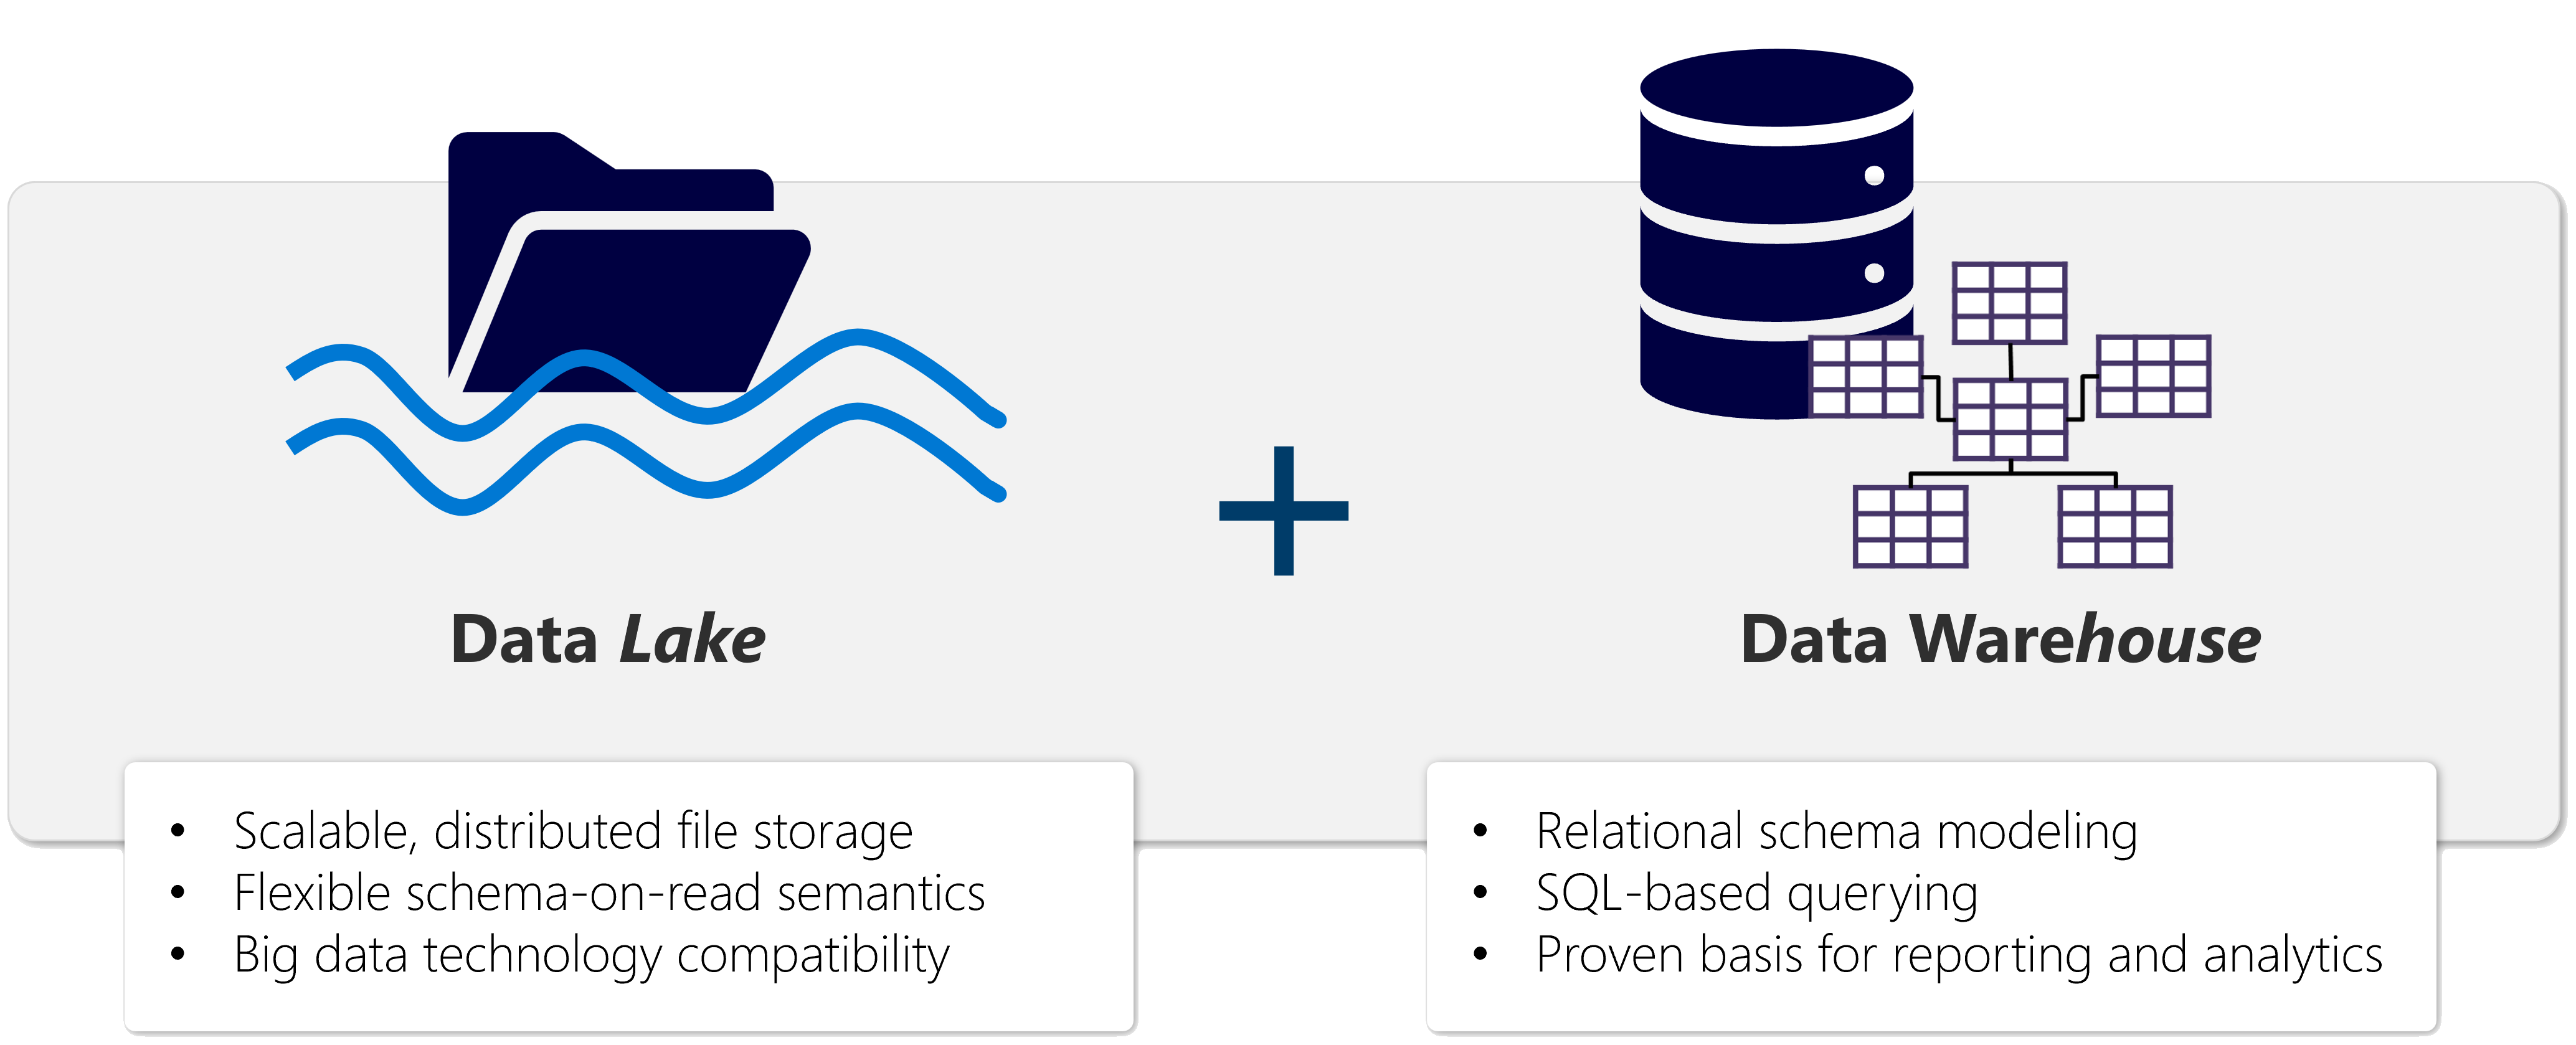
- Scalable Storage: Draws from the vast, flexible storage landscape of a data lake, accommodating a wide variety of data types.
- Advanced Querying: Leverages the established SQL and Apache Spark compute engines, enabling sophisticated big data processing.
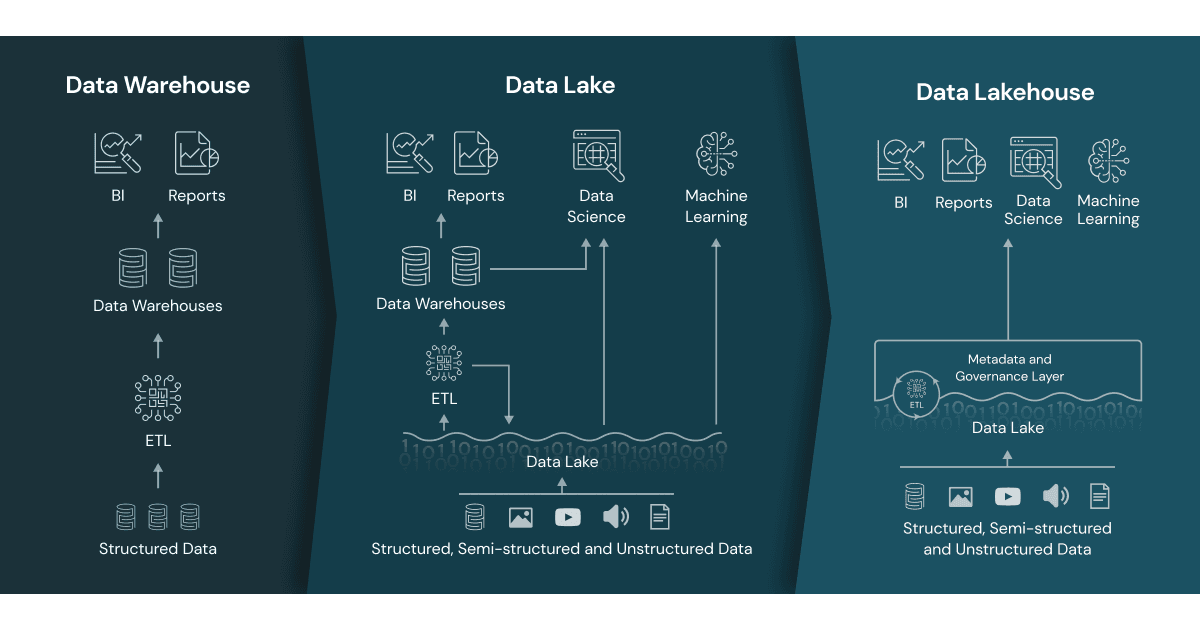
Real-World Application: Imagine a company grappling with the limitations of a traditional data warehouse, struggling to manage and analyze structured data (like order histories and customer information) alongside unstructured data (such as social media insights and web logs). The introduction of Microsoft Fabric’s Lakehouse addresses these challenges head-on.
By adopting Microsoft Fabric’s Lakehouse, companies can revolutionize their approach to data analysis, breaking free from the constraints of older systems and embracing a more flexible, scalable, and comprehensive data management solution.
Microsoft Fabric’s Lakehouse
In today’s data-driven world, the concept of a “Lakehouse” is revolutionizing how we handle large-scale data analytics. A Lakehouse, such as the one offered by Microsoft Fabric, is an innovative blend of a data lake’s flexibility and a data warehouse’s analytical capabilities. It’s designed to store a variety of data formats and is accessible through multiple analytics tools and programming languages. Thanks to its cloud-based nature, it offers scalability, high availability, and disaster recovery options.
Key Benefits of a Lakehouse:
- Versatility in Data Processing: By leveraging both Spark and SQL engines, lakehouses can handle large-scale data processing, which is crucial for machine learning and predictive modeling.
- Schema-on-Read Format: This approach allows users to define schemas as needed, instead of relying on pre-established ones. It offers flexibility in managing data.
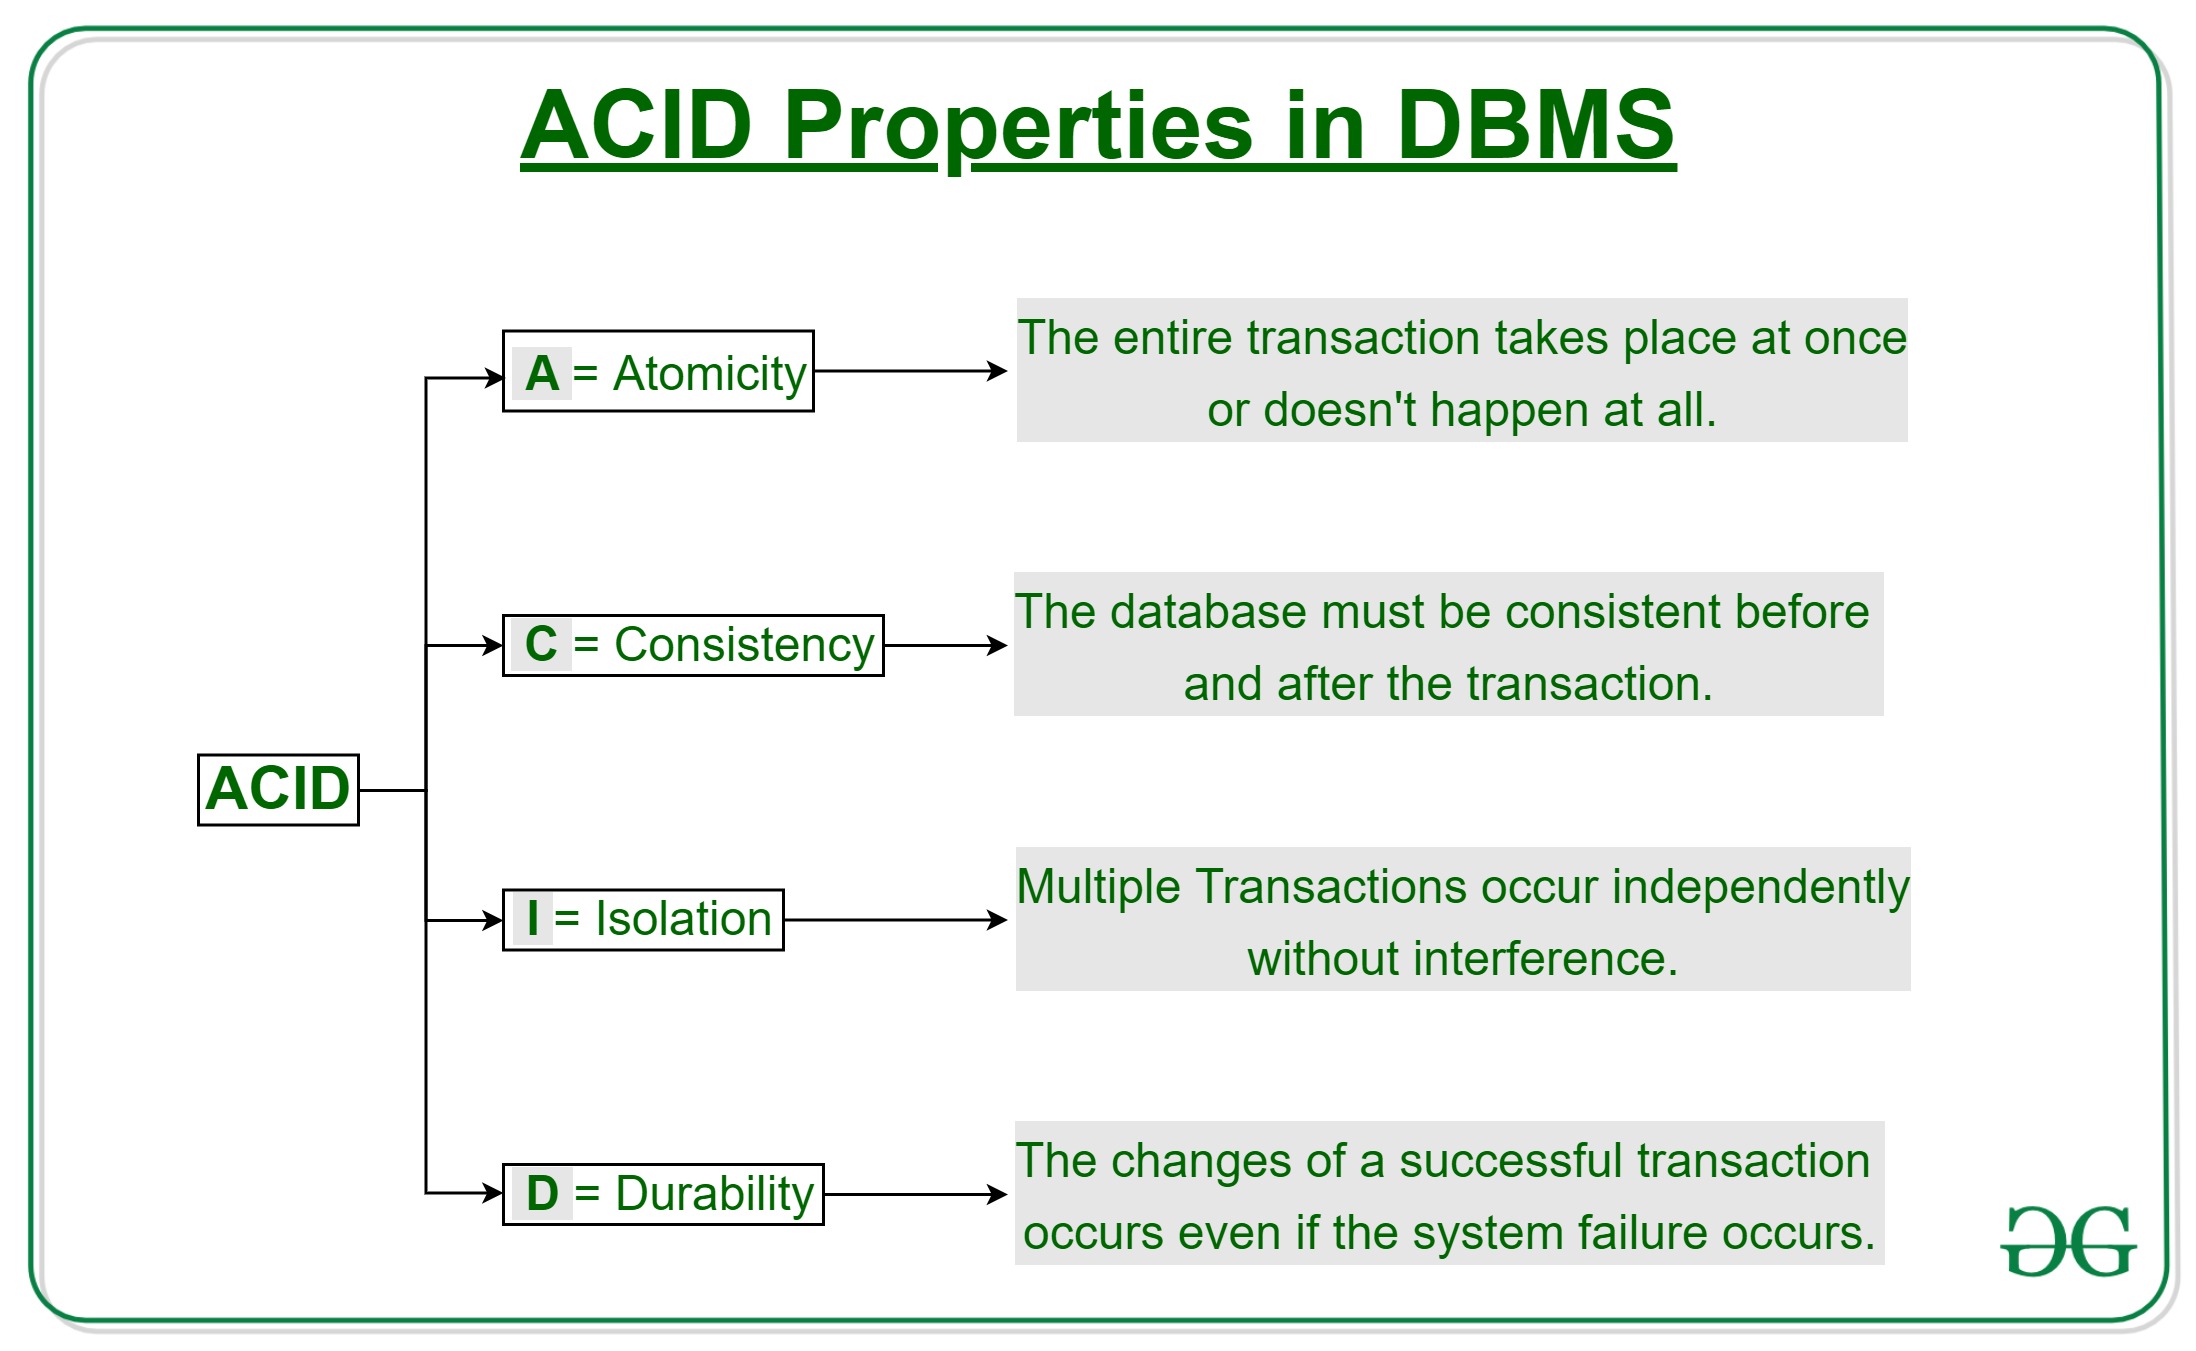
- ACID Transaction Support: Through Delta Lake formatted tables, lakehouses ensure data integrity and consistency, adhering to the ACID (Atomicity, Consistency, Isolation, Durability) principles.
- Centralized Data Hub: Serving as a single point of access, lakehouses simplify the workflow for various data professionals, enhancing collaboration and efficiency.
Microsoft Fabric Lakehouse robust architecture enables seamless data ingestion from diverse sources, be it local files, databases, or APIs. The integration of Data Factory Pipelines and Dataflows (Gen2) further automates this process, adding a layer of sophistication and ease.
Data Manipulation and Governance:
Once data is ingested, it can be explored and transformed using tools like Notebooks or Dataflows (Gen2), the latter offering a familiar interface for those accustomed to Excel or Power BI. Moreover, the platform allows for complex data transformation processes through Data Factory Pipelines. Post-transformation, the data is ready for a multitude of uses, including SQL querying, machine learning model training, real-time analytics, or report generation in Power BI. Importantly, Microsoft Fabric Lakehouse also incorporates essential data governance policies, ensuring data classification and secure access control.
Working with Microsoft Fabric Lakehouse:
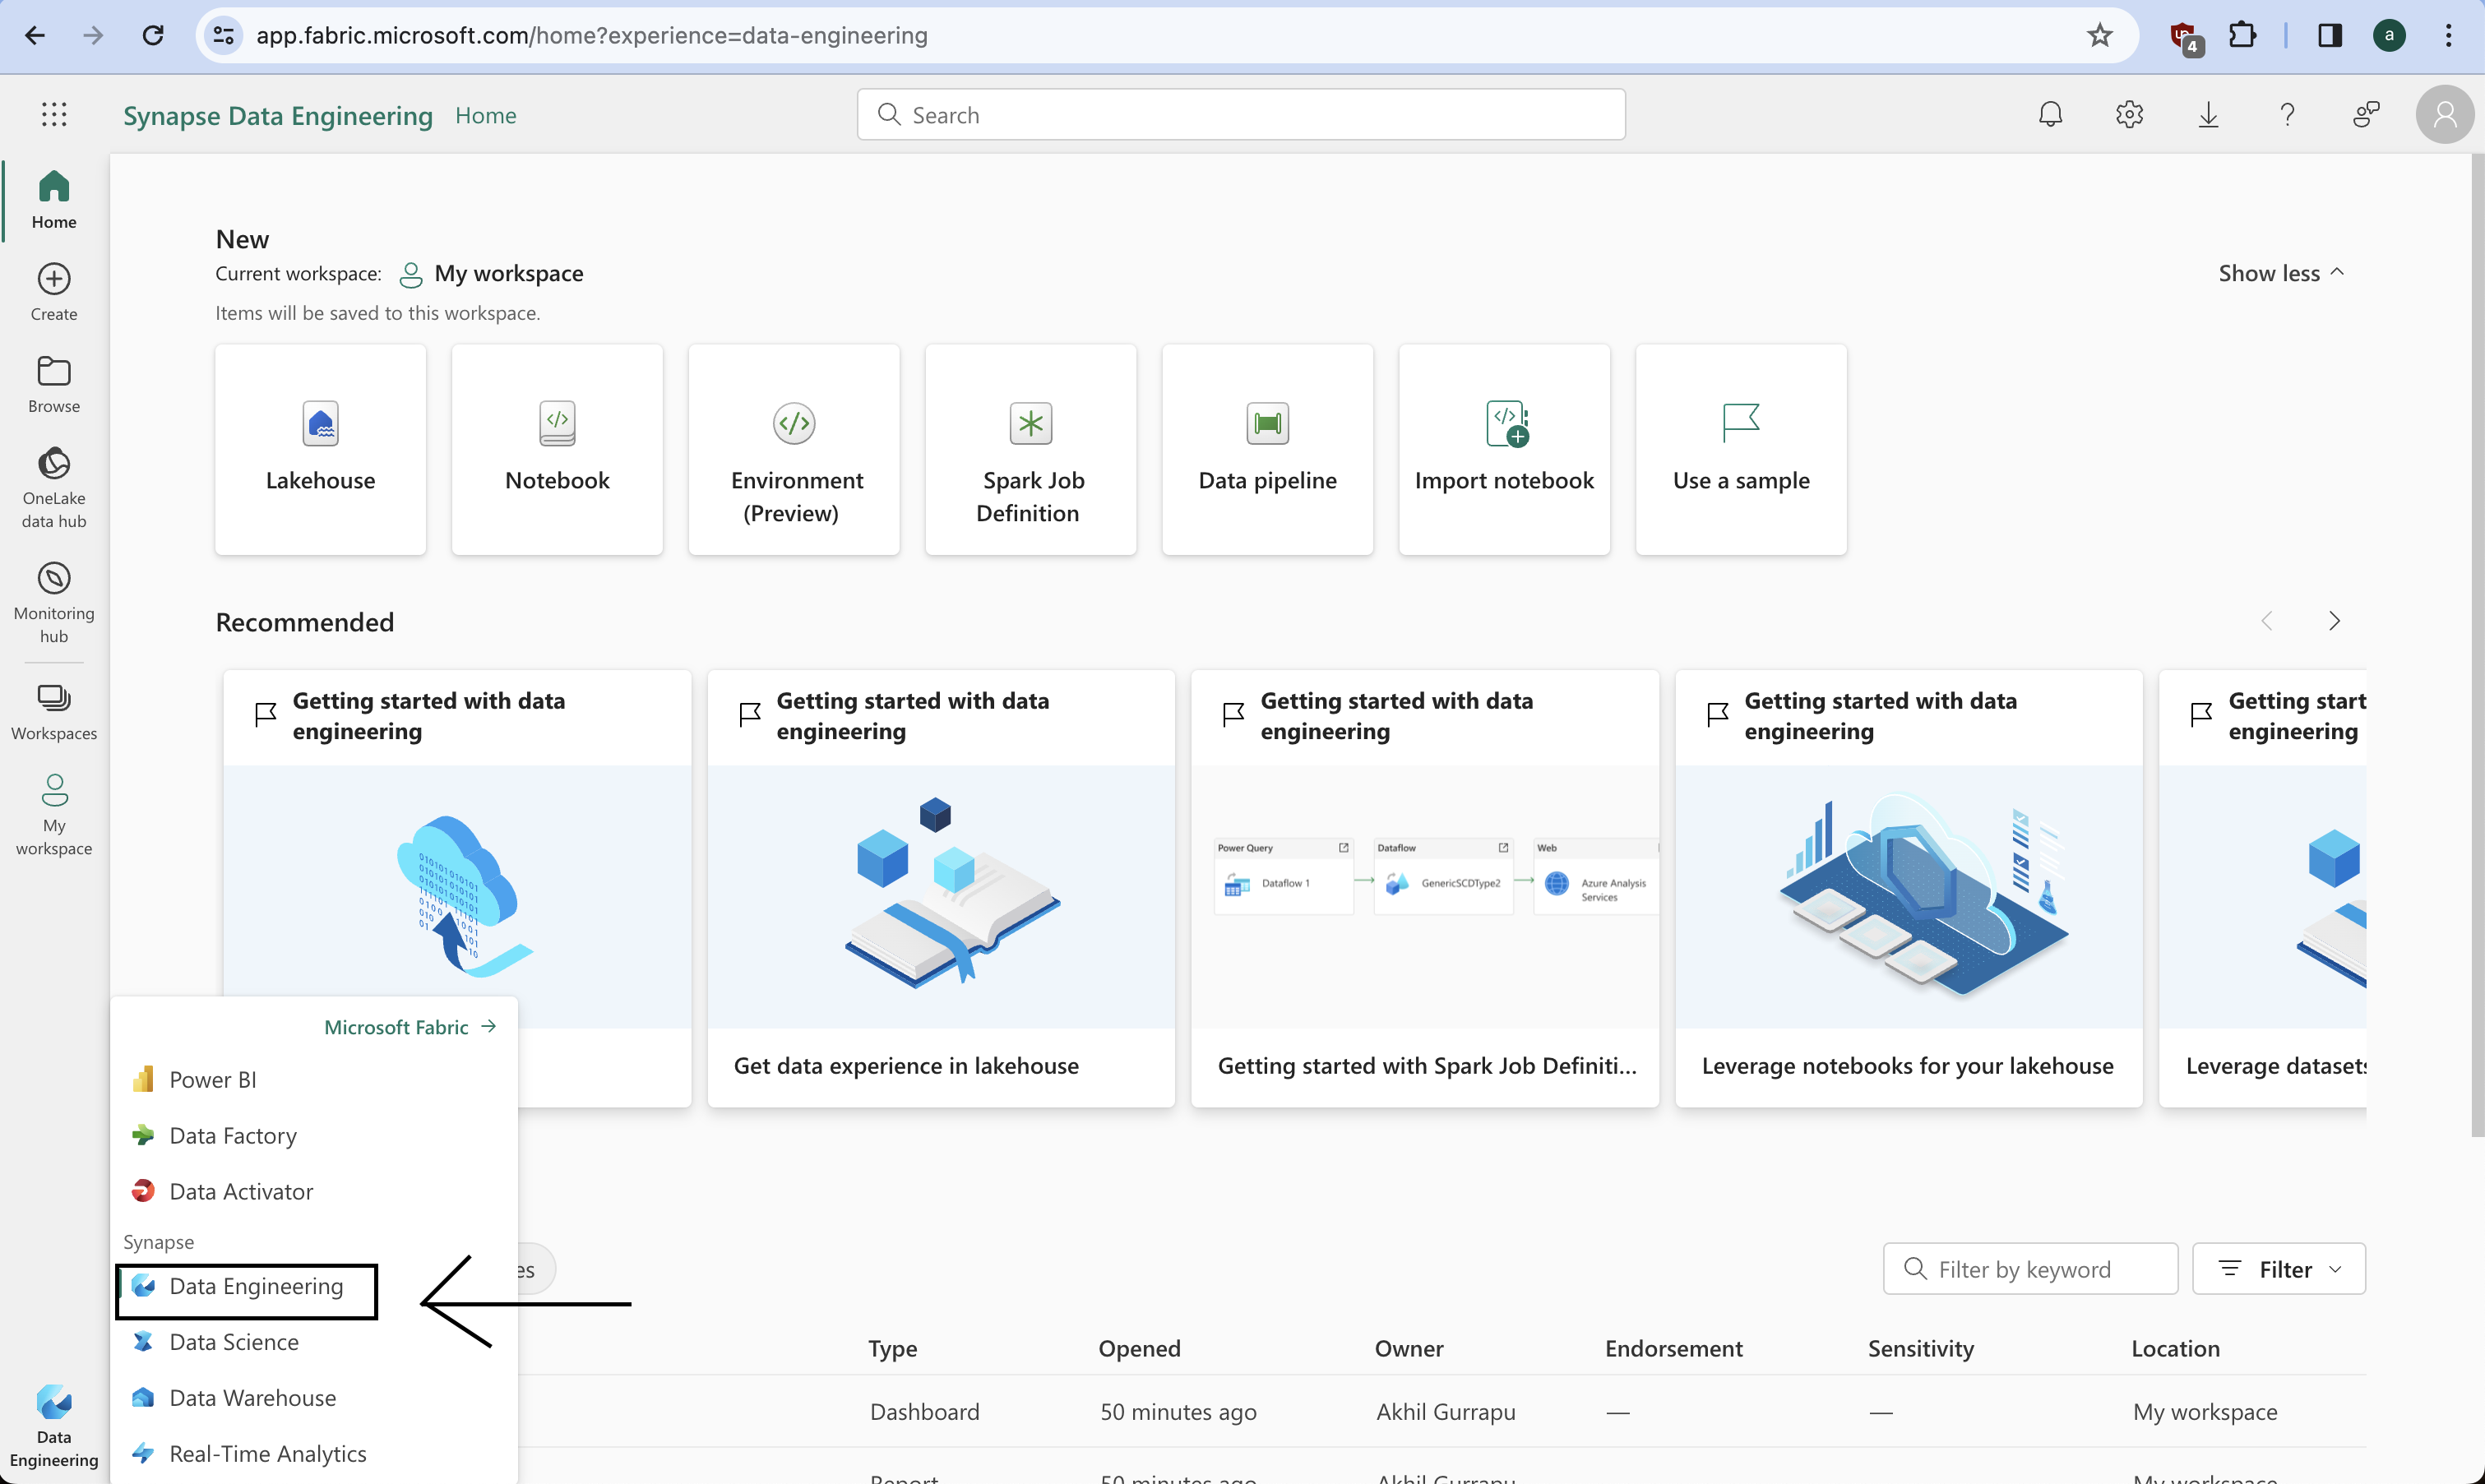
Creating Lakehouse:
Microsoft Fabric Lakehouses offer a revolutionary way to manage and interact with data. These Lakehouses, part of the Data Engineering workload, provide a comprehensive environment for data storage, analysis, and reporting.
Key Components of a Fabric Lakehouse:
- Lakehouse Storage and Metadata: This is the core of your lakehouse, where you interact with various files, folders, and table data.
- Semantic Model (Default): Created automatically based on the tables in your lakehouse, this data model is instrumental for building Power BI reports.
- SQL Endpoint: A read-only SQL endpoint allows you to connect and query data using Transact-SQL.
Lakehouse Explorer Modes:
- Lakehouse Mode: In this mode, you can add and interact with tables, files, and folders in the lakehouse.
- SQL Endpoint Mode: This mode allows you to use SQL for querying tables and managing the relational data model.
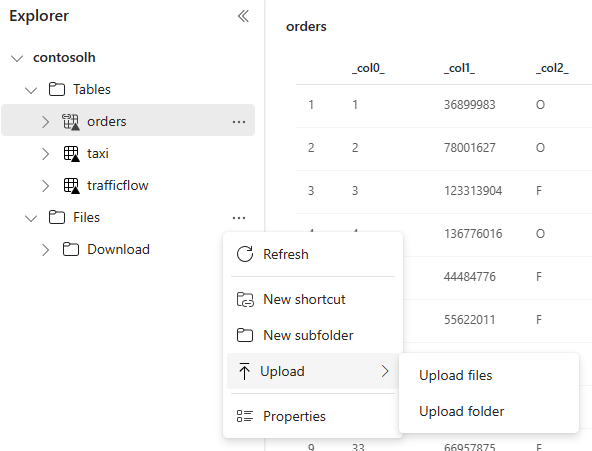
Ingesting Data into a Lakehouse:
- Upload: Directly upload local files or folders.
- Dataflows (Gen2): Import and transform data from various sources using Power Query Online.
- Notebooks: Utilize Fabric notebooks for data ingestion and transformation.
- Data Factory Pipelines: These facilitate the copying of data and orchestration of data processing activities.
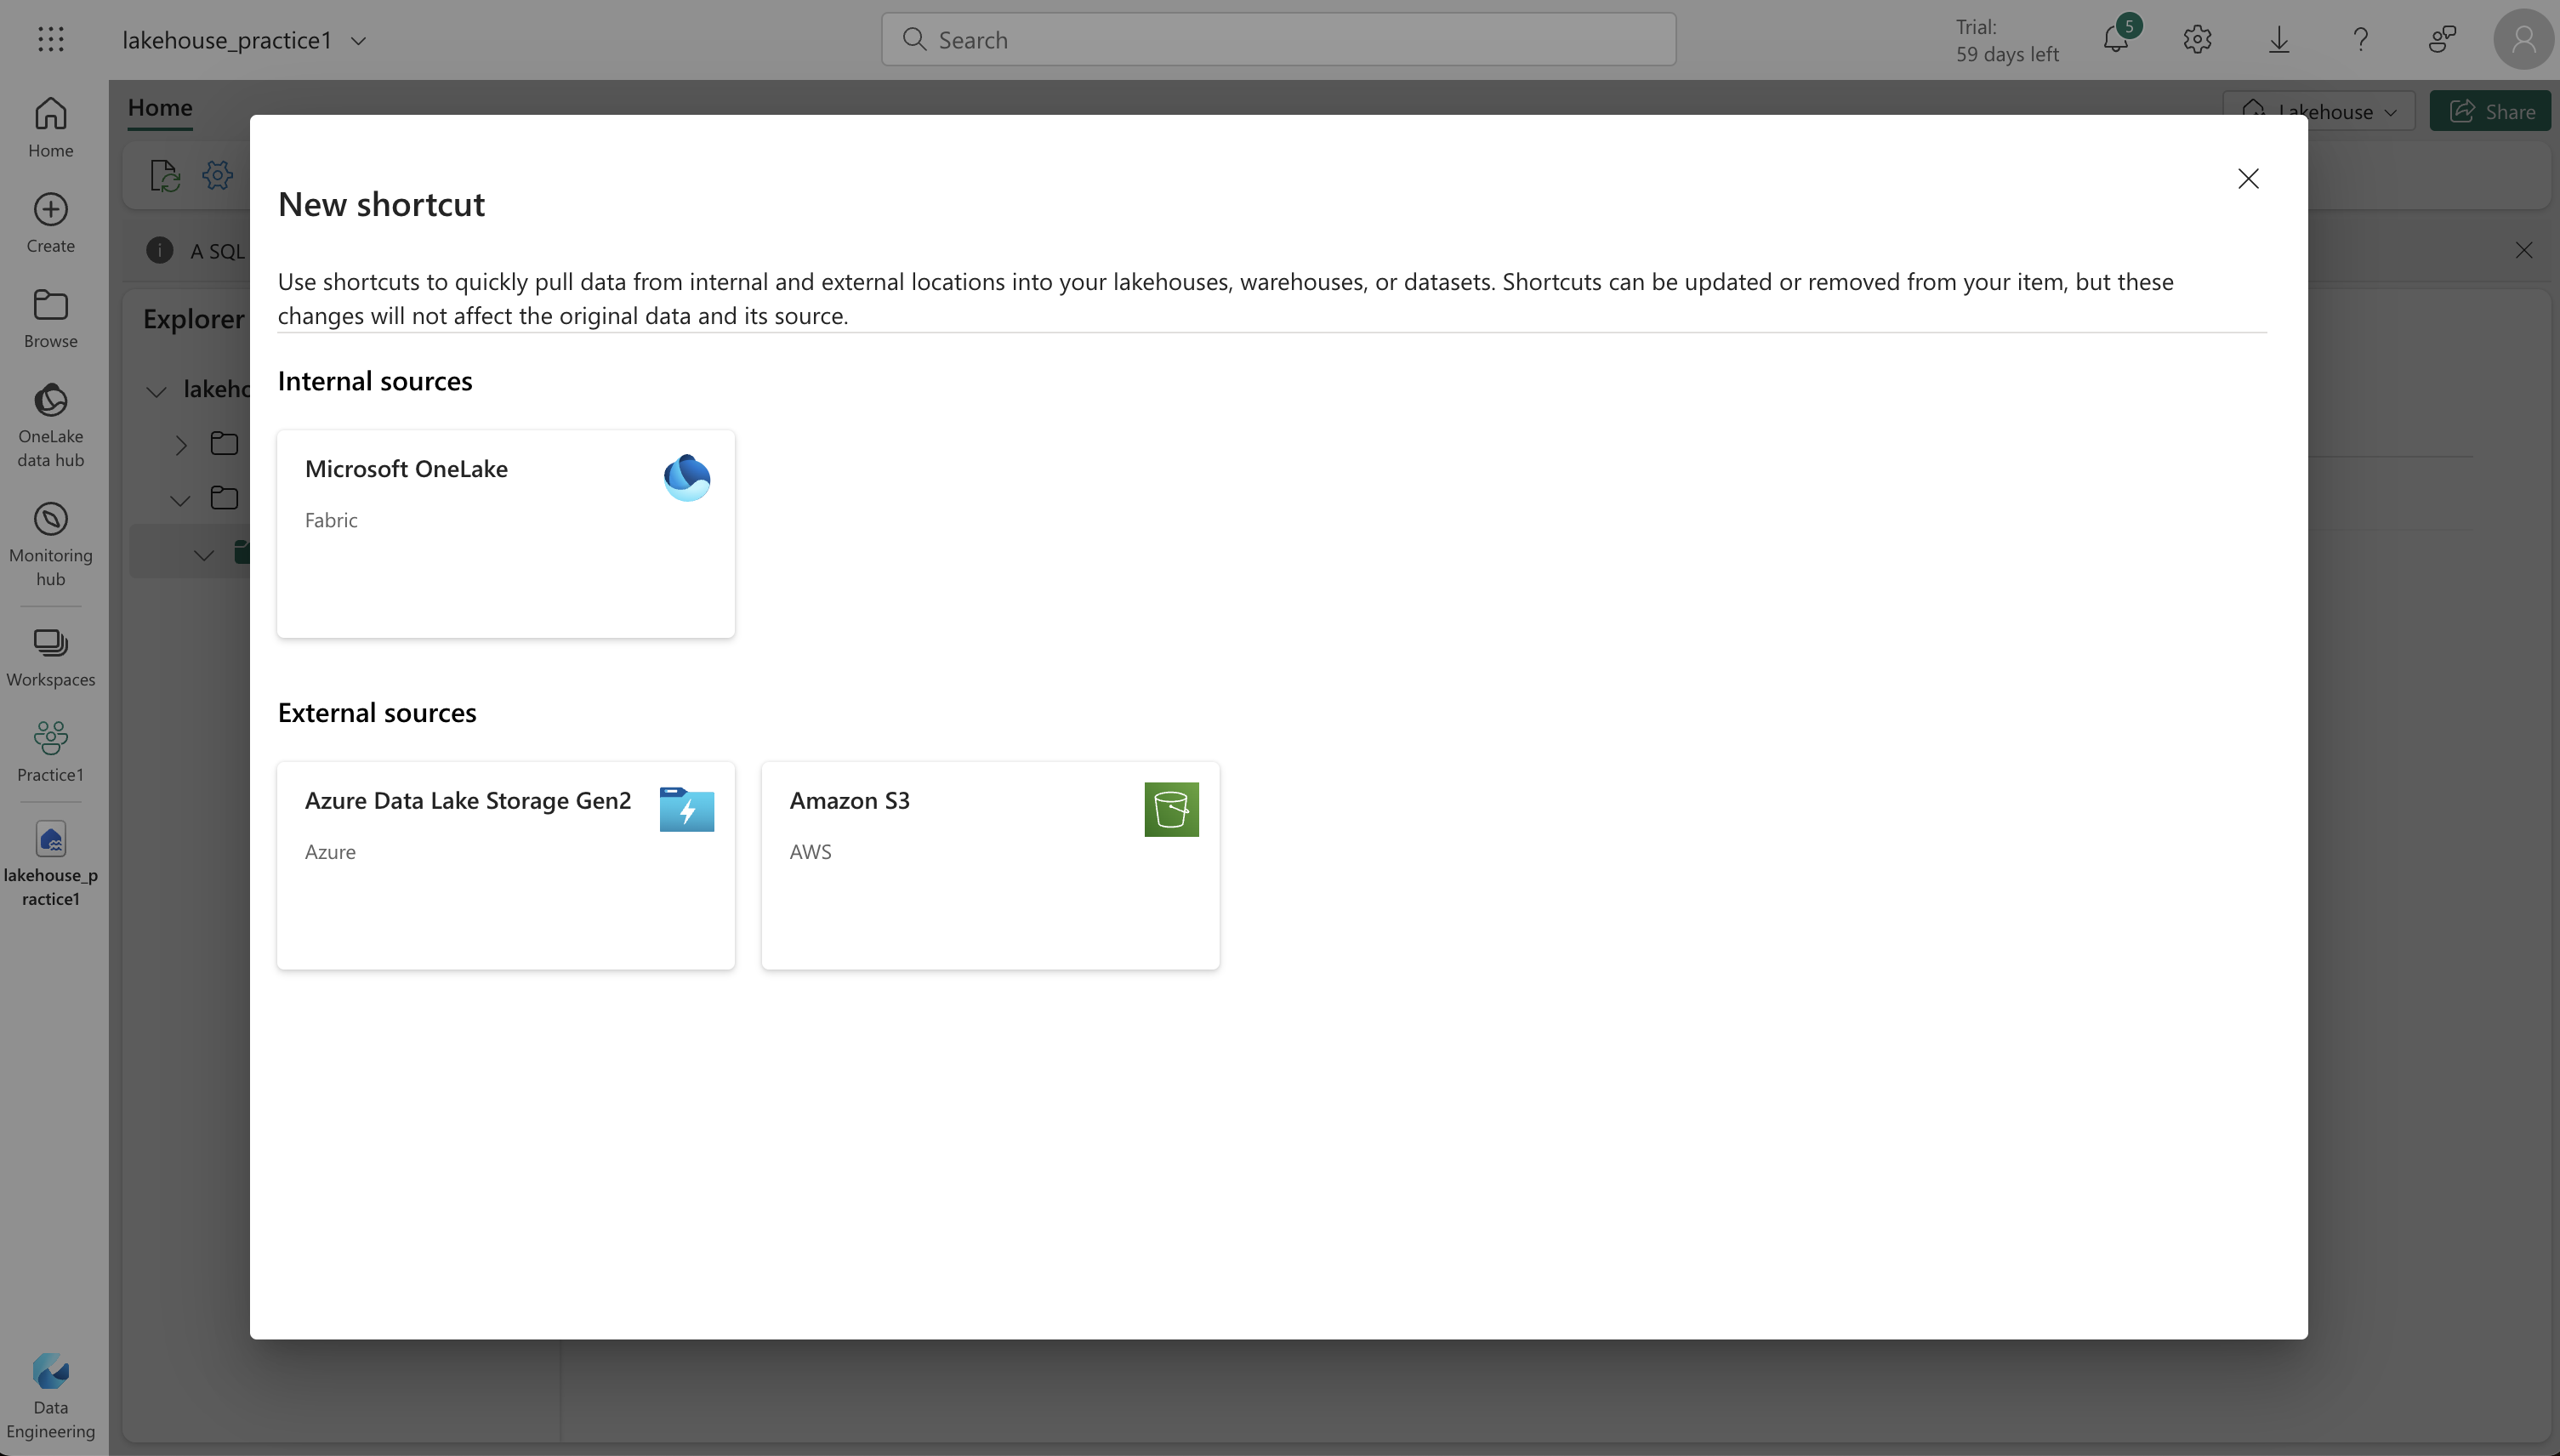
Accessing Data with Shortcuts:
Shortcuts in Fabric provide an innovative way to integrate data into your lakehouse while keeping it in external storage. Useful for sourcing data from different storage accounts or cloud providers, shortcuts in your lakehouse can point to various locations and facilitate access to data warehouses, KQL databases, and other lakehouses. For Example: including data in an external Azure Data Lake Store Gen2 location in your lakehouse, without the requirement to copy the data.
Security and Permissions:
Data permissions and credentials are managed by OneLake. Accessing data through shortcuts involves the identity of the user, who must have the necessary permissions in the target location.
Exploring and Transforming Data in a Lakehouse:
Exploring and transforming data in a lakehouse is an integral part of managing and utilizing big data. A lakehouse combines the flexibility of a data lake with the management features of a data warehouse. Here are the key tools and techniques to achieve this:
- Apache Spark: Spark pools in Fabric lakehouses allow for processing data using Scala, PySpark, or Spark SQL. This is ideal for handling data in files and tables within the lakehouse.
- Notebooks: These are interactive coding interfaces for directly reading, transforming, and writing data to the lakehouse. They’re user-friendly and great for hands-on data manipulation.
- Spark Job Definitions: For automated or scheduled data processing, these scripts use the Spark engine, enabling efficient and regular data handling.
- SQL Analytic Endpoint: This feature allows running Transact-SQL statements for querying and manipulating data in lakehouse tables. It’s a powerful tool for those familiar with SQL.
- Dataflows (Gen2): Beyond initial data ingestion, Dataflows in Gen2 can transform data through Power Query, with an option to return the transformed data to the Lakehouse.
- Data Pipelines: These orchestrate complex transformations, combining dataflows, Spark jobs, and other logic. They are crucial for managing intricate data processes.
The data within a lakehouse can also be analyzed and visualized. The tables form part of a semantic model which defines the data’s relational structure. This model can be edited to include custom measures, hierarchies, and aggregations.
Utilizing Power BI, one can visualize and analyze this data, combining Power BI’s visualization capabilities with the centralized storage and structured schema of a data lakehouse. This synergy enables an efficient, end-to-end analytics solution on a single platform.