Microsoft Fabric Lakehouse and Medallion Architecture
Explore how Fabric's Lakehouse solution, empowered by the flexible Medallion Architecture, transforms data handling and analytics for businesses. Learn about the architecture's layers, implementation, simplified data querying, reporting, and best practices for secure and efficient data management.

Managing Data in the Fabric Lakehouse with Medallion Architecture
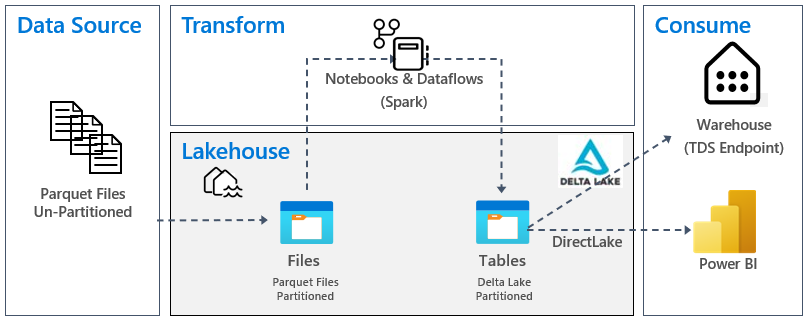
In today’s data-centric world, managing and analyzing vast data sources is essential for business growth. The Fabric lakehouse, a blend of data lakes and data warehouses, emerges as a premier solution for this challenge. The medallion architecture, now a benchmark in the industry, is at the heart of lakehouse-based analytics.
Understanding Medallion Architecture in Data Lakehouses
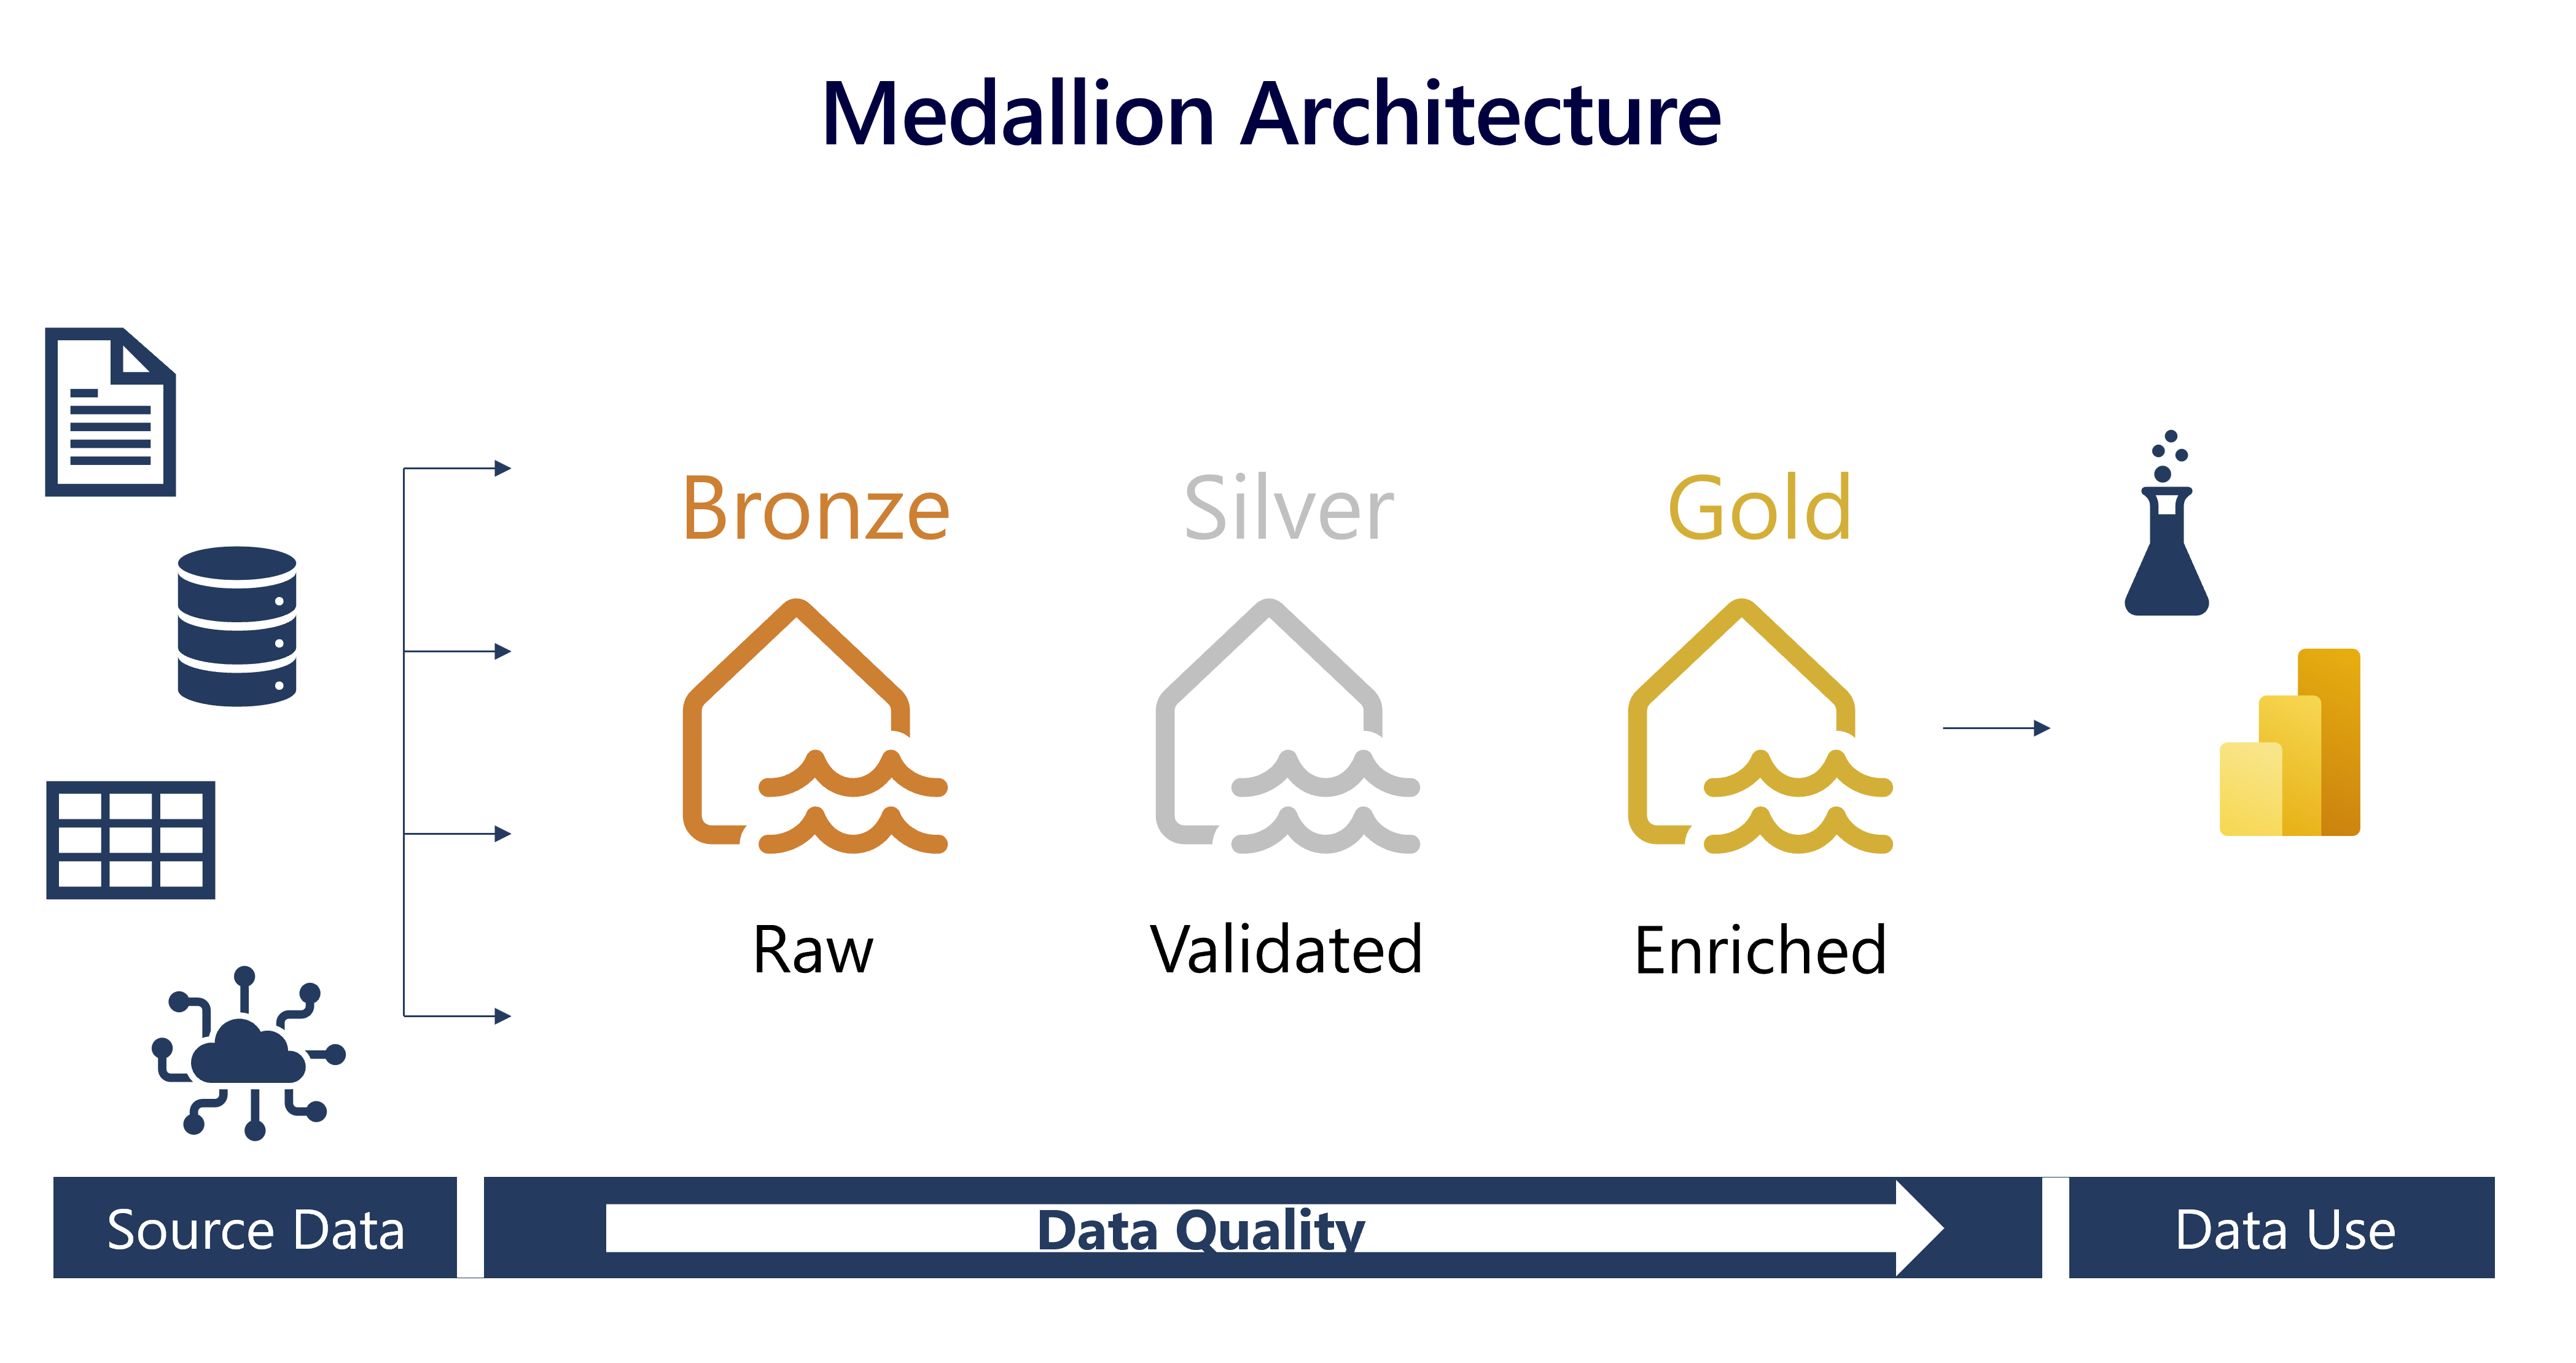
Medallion architecture is a strategic approach for organizing data in a lakehouse environment, particularly relevant in systems using Delta Lake format. This architecture is crucial for maintaining high data quality through various stages of processing. It consists of three primary layers:
-
Bronze Layer (Raw Data): This is the entry point of data into the lakehouse, encompassing all forms of data – structured, semi-structured, or unstructured. Stored in its native format, the bronze layer represents the raw, unaltered state of data.
-
Silver Layer (Validated Data): As data progresses, it reaches the silver layer where it undergoes validation and cleansing. This stage involves removing inconsistencies, merging datasets, and deduplicating. The silver layer acts as a central hub, preparing data in a consistent format for further refinement.
-
Gold Layer (Enriched Data): The final stage is the gold layer where data is tailored to meet specific business and analytical needs. This includes tasks like data aggregation at various granularities and enrichment with external datasets. Data in the gold layer is primed for use in advanced applications like analytics and machine learning.
The medallion architecture is not rigid; it’s flexible and can be customized to an organization’s needs. For instance, additional layers like a pre-bronze “raw” layer or a post-gold “platinum” layer can be integrated for specialized processing needs.
Moving Data in Fabric’s Lakehouse
In Fabric’s lakehouse, moving data across these layers is crucial for refining and preparing it for downstream applications. This process involves considering:
- The volume of data.
- Complexity of transformations.
- Frequency of data movement.
- Preferred tools for data handling.
In this context, two main activities are involved:
-
Data Transformation: It involves altering data’s structure or content to fit specific requirements. Tools like Dataflows (Gen2) and notebooks in Fabric cater to different needs – Dataflows for simpler, smaller datasets and notebooks for complex, larger datasets.
-
Data Orchestration: This is about managing and coordinating multiple data processes to achieve a desired outcome. Fabric uses pipelines for this purpose, automating and scheduling data movement across different medallion layers.
Implementing a Medallion Architecture in Fabric: A Simplified Guide
-
Set Up Your Lakehouse: Begin by establishing a Fabric lakehouse, which serves as the foundation for your medallion architecture. Depending on your needs, you can opt for a single lakehouse for multiple architectures or separate lakehouses in different workspaces.
-
Design Your Architecture: Map out your architecture layout, defining three key layers – Bronze, Silver, and Gold. Each layer has a distinct role:
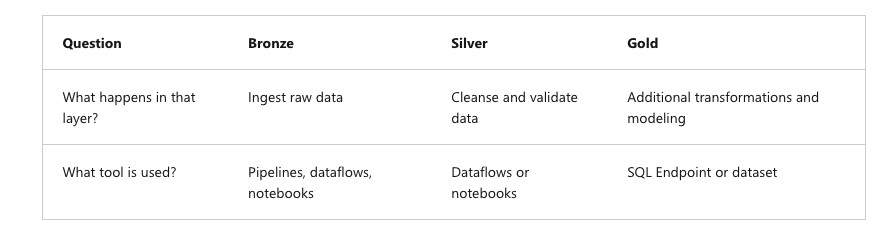
- Bronze Layer (Raw Data): Ingest raw data using pipelines, dataflows, or notebooks.
- Silver Layer (Curated Data): Focus on cleansing and validating data. Use dataflows or notebooks for transformations aimed at ensuring data quality and consistency.
- Gold Layer (Presentation Layer): This layer is for modeling data in a star schema, optimized for reporting. It involves additional transformations and modeling, typically using SQL endpoints or datasets.
-
Ingest Data into Bronze: Choose your method for ingesting data into the bronze layer, such as pipelines, dataflows, or notebooks.
-
Transform Data for Silver Layer: In the silver layer, transform your data to ensure high quality and consistency. This step also involves the use of dataflows or notebooks.
-
Generate the Gold Layer: This is a crucial step where you model your data for reporting. The gold layer can be tailored for different audiences or domains, like separate layers for finance, sales, or data science teams. You might also opt for using a Data Warehouse as your gold layer. In Fabric, transform your data using dataflows or notebooks, then load it into a gold Delta table in the lakehouse. Connect this to a SQL endpoint for data modeling.
-
Enable Downstream Consumption: Finally, decide how you’ll facilitate the downstream consumption of your data. This can be done through workspace or item permissions, or by connecting to the SQL endpoint of your data layers.
Simplified Data Querying and Reporting
The integration of medallion architecture in Fabric lakehouse has revolutionized the way data teams and businesses interact with their data. This article delves into the efficient querying and reporting capabilities offered by Fabric, highlighting its SQL endpoints, Direct Lake mode in Power BI datasets, and the tailorability of medallion layers.
Querying Data in Your Lakehouse:
-
Utilizing SQL in Gold Layer: Teams can leverage SQL to probe and query data within the gold layer of the medallion architecture. This includes analyzing delta tables, creating views, and implementing SQL security.
-
SQL Endpoint Features: Fabric’s SQL endpoint allows for effective data management and querying, including a visual query experience.
-
Read-Only SQL Endpoint: It’s crucial to note that the SQL endpoint is read-only for lakehouse delta tables. Modifications to data require alternative methods like dataflows, notebooks, or pipelines.
Power BI Integration:
-
Direct Lake Mode: Fabric facilitates the creation of Power BI datasets in Direct Lake mode, allowing seamless querying of lakehouse data. This mode combines the efficiency of a semantic model with the freshness of lakehouse data.
-
Default Dataset Provisioning: When establishing a lakehouse, a default dataset is automatically set up. This dataset acts as a semantic model, enhancing data retrieval efficiency by preloading and updating frequently requested data.
Tailoring Medallion Layers for Specific Needs:
-
Customizable Gold Layers: The medallion architecture’s flexibility is exemplified by the ability to create multiple Gold layers tailored to different user groups like finance, sales, and data science.
-
Optimized Data Formats: The architecture can also be utilized to generate data in formats required by various applications, tools, or systems.
Essential Steps for Managing Your Lakehouse: Security and CI/CD Best Practices
Managing a lakehouse requires careful consideration of both security measures and continuous integration and continuous delivery (CI/CD) processes. Here’s a concise guide to effectively handle these aspects:
-
Securing Your Lakehouse:
-
Workspace-Level Security: Control access by setting permissions at the workspace level. This ensures that only authorized users can access all items within a given workspace.
-
Item-Level Permissions: For more granular control, use item-level permissions. This is ideal when working with external collaborators who require access to specific items only.
-
Layered Storage Approach: Enhance security and efficiency by storing different layers of your lakehouse in separate workspaces. This strategy balances security with cost-effectiveness.
-
Layer-Specific Access Controls:
- Gold Layer: Limit access to read-only, maintaining strict controls on this crucial layer.
- Silver Layer: Decide on user permissions for building upon this layer, ensuring a balance between flexibility and security.
- Bronze Layer: Restrict to read-only access, similar to the Gold layer, for essential data protection.
-
Collaboration and Sharing: Align any sharing of Fabric content with your organization’s security policies by consulting the security team.
-
-
CI/CD for Lakehouse Management:
-
Integrate Data Quality Checks and Version Control: Implement quality checks and version control for reliable and efficient data pipeline deployments.
-
Automated Deployments and Monitoring: Utilize automation to reduce manual errors and ensure consistent, updated data insights.
-
Security Measures in CI/CD: Incorporate robust security practices within your CI/CD processes.
-
Scalability and Disaster Recovery: Plan for scalability and have disaster recovery strategies in place.
-
Collaboration and Compliance: Ensure that CI/CD processes facilitate collaboration and adhere to compliance standards.
-
Continuous Improvement: Regularly evaluate and improve the CI/CD processes for optimal performance.
-
Git Integration in Fabric: Leverage Fabric’s Git integration for backup, version control, collaboration, and managing changes efficiently.
-
-
CI/CD at the Gold Layer:
- Importance of CI/CD: At the gold layer, CI/CD is crucial to guarantee the availability of high-quality, reliable data for downstream users and applications. It enhances data accuracy and supports data-driven decisions effectively.
Step-by-Step Guide to Building a Medallion Architecture in Microsoft Fabric Lakehouse
Introduction
In today’s fast-paced data-driven world, setting up an efficient data architecture is crucial. Microsoft Fabric Lakehouse offers a robust solution, and in this guide, we’ll walk through creating a Medallion architecture in this environment using notebooks. This process will take you around 45 minutes, assuming you have a Microsoft school or work account. If not, you can sign up for a Microsoft Office 365 E3 trial or higher.
1. Creating Your Workspace
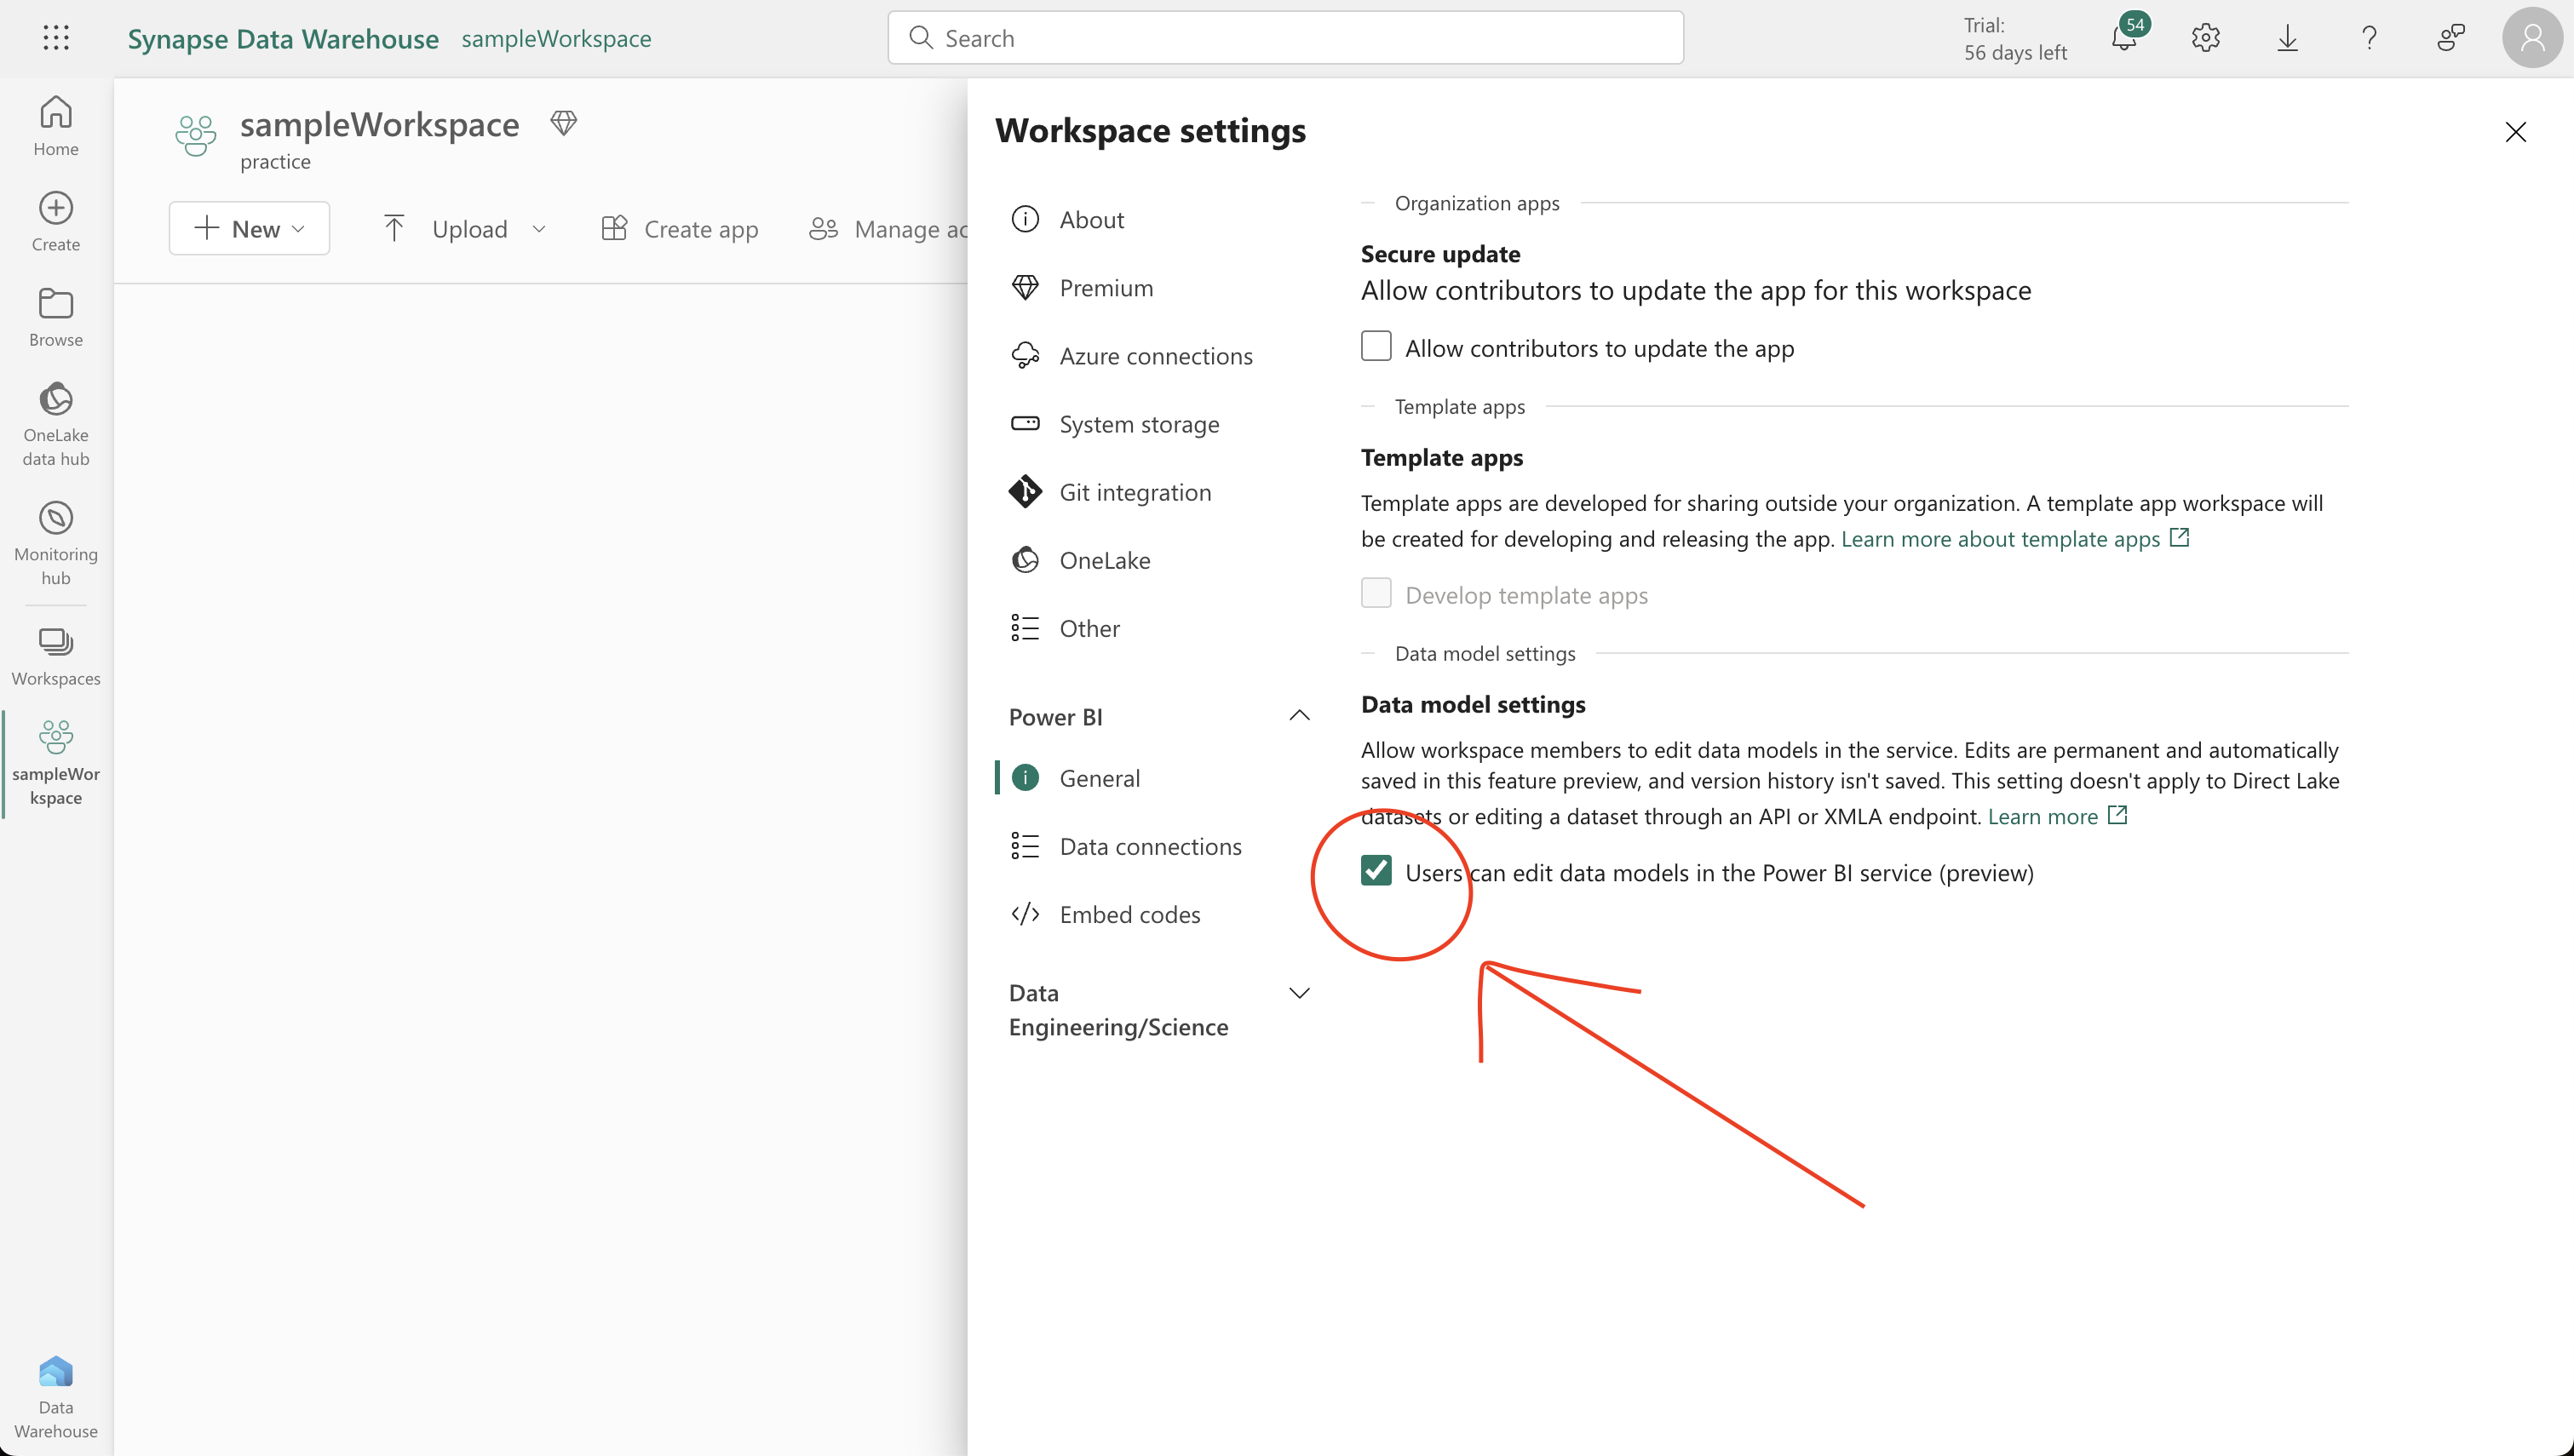
Start by navigating to the Microsoft Fabric homepage and selecting Synapse Data Engineering. From there, create a new workspace by choosing a license with Fabric capacity, like Trial, Premium, or Fabric. Remember to enable the Data model editing preview feature in workspace settings for creating table relationships.
2. Setting Up the Lakehouse and Bronze Layer
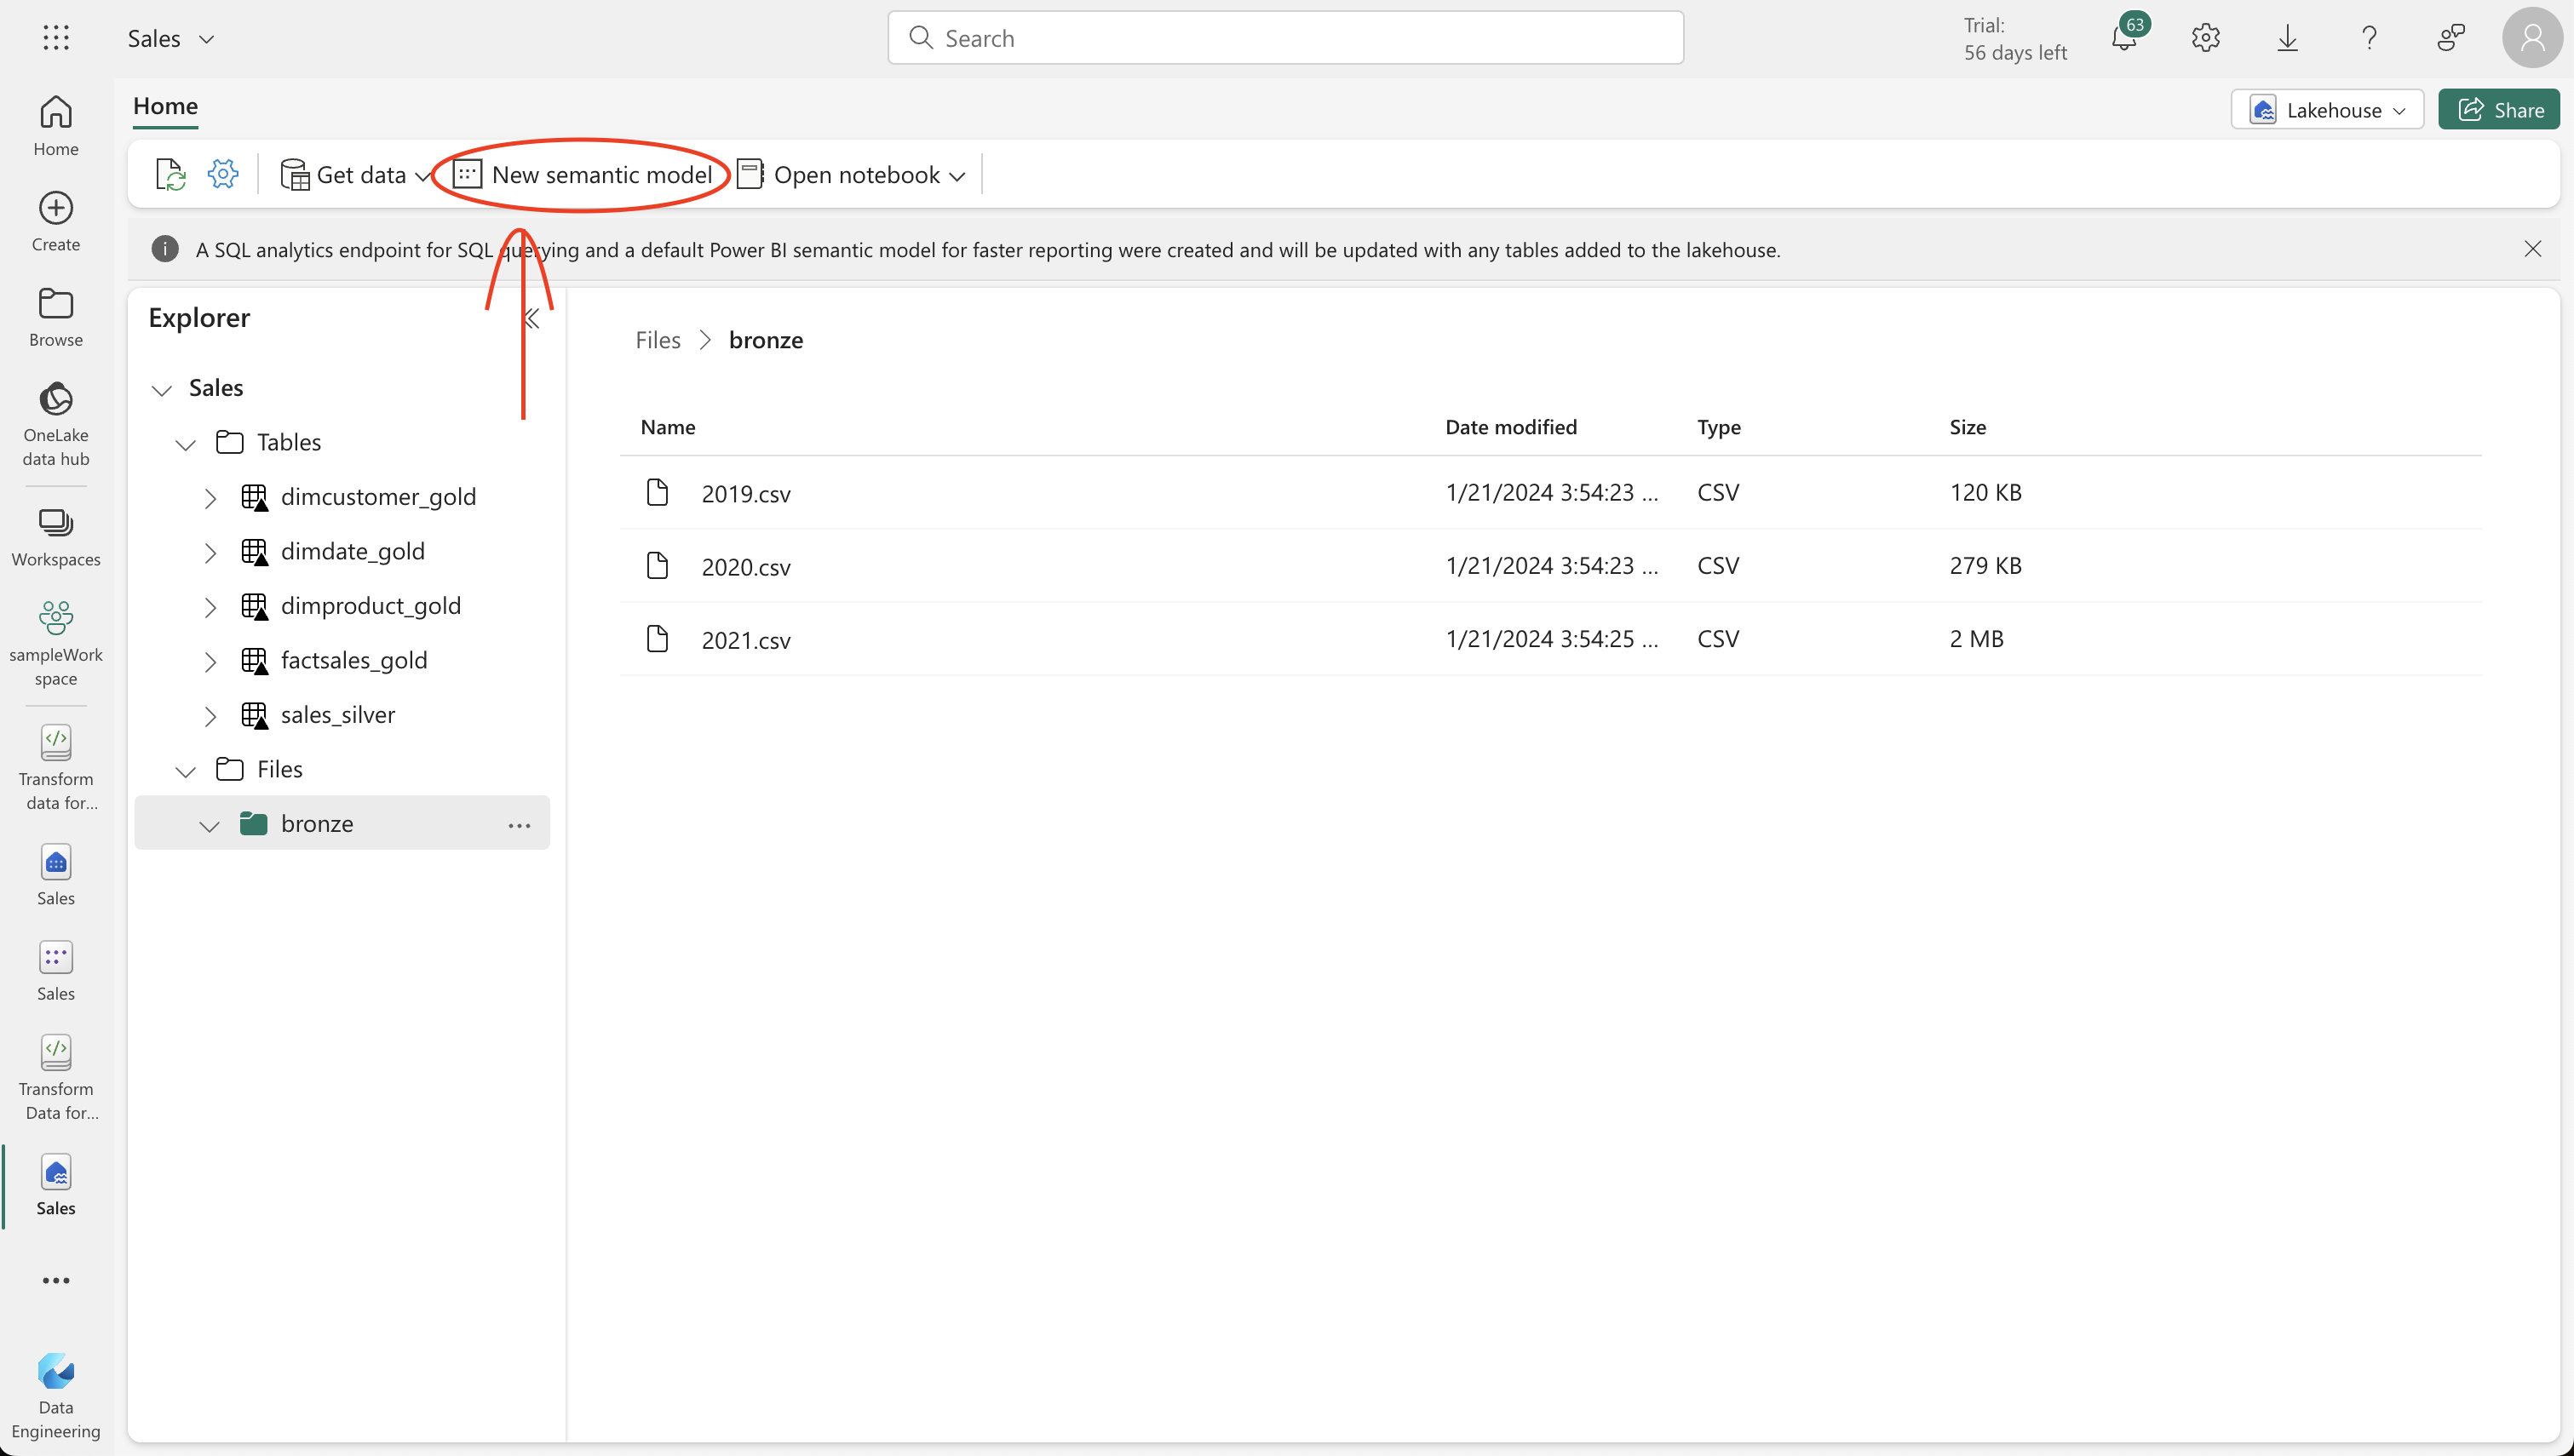
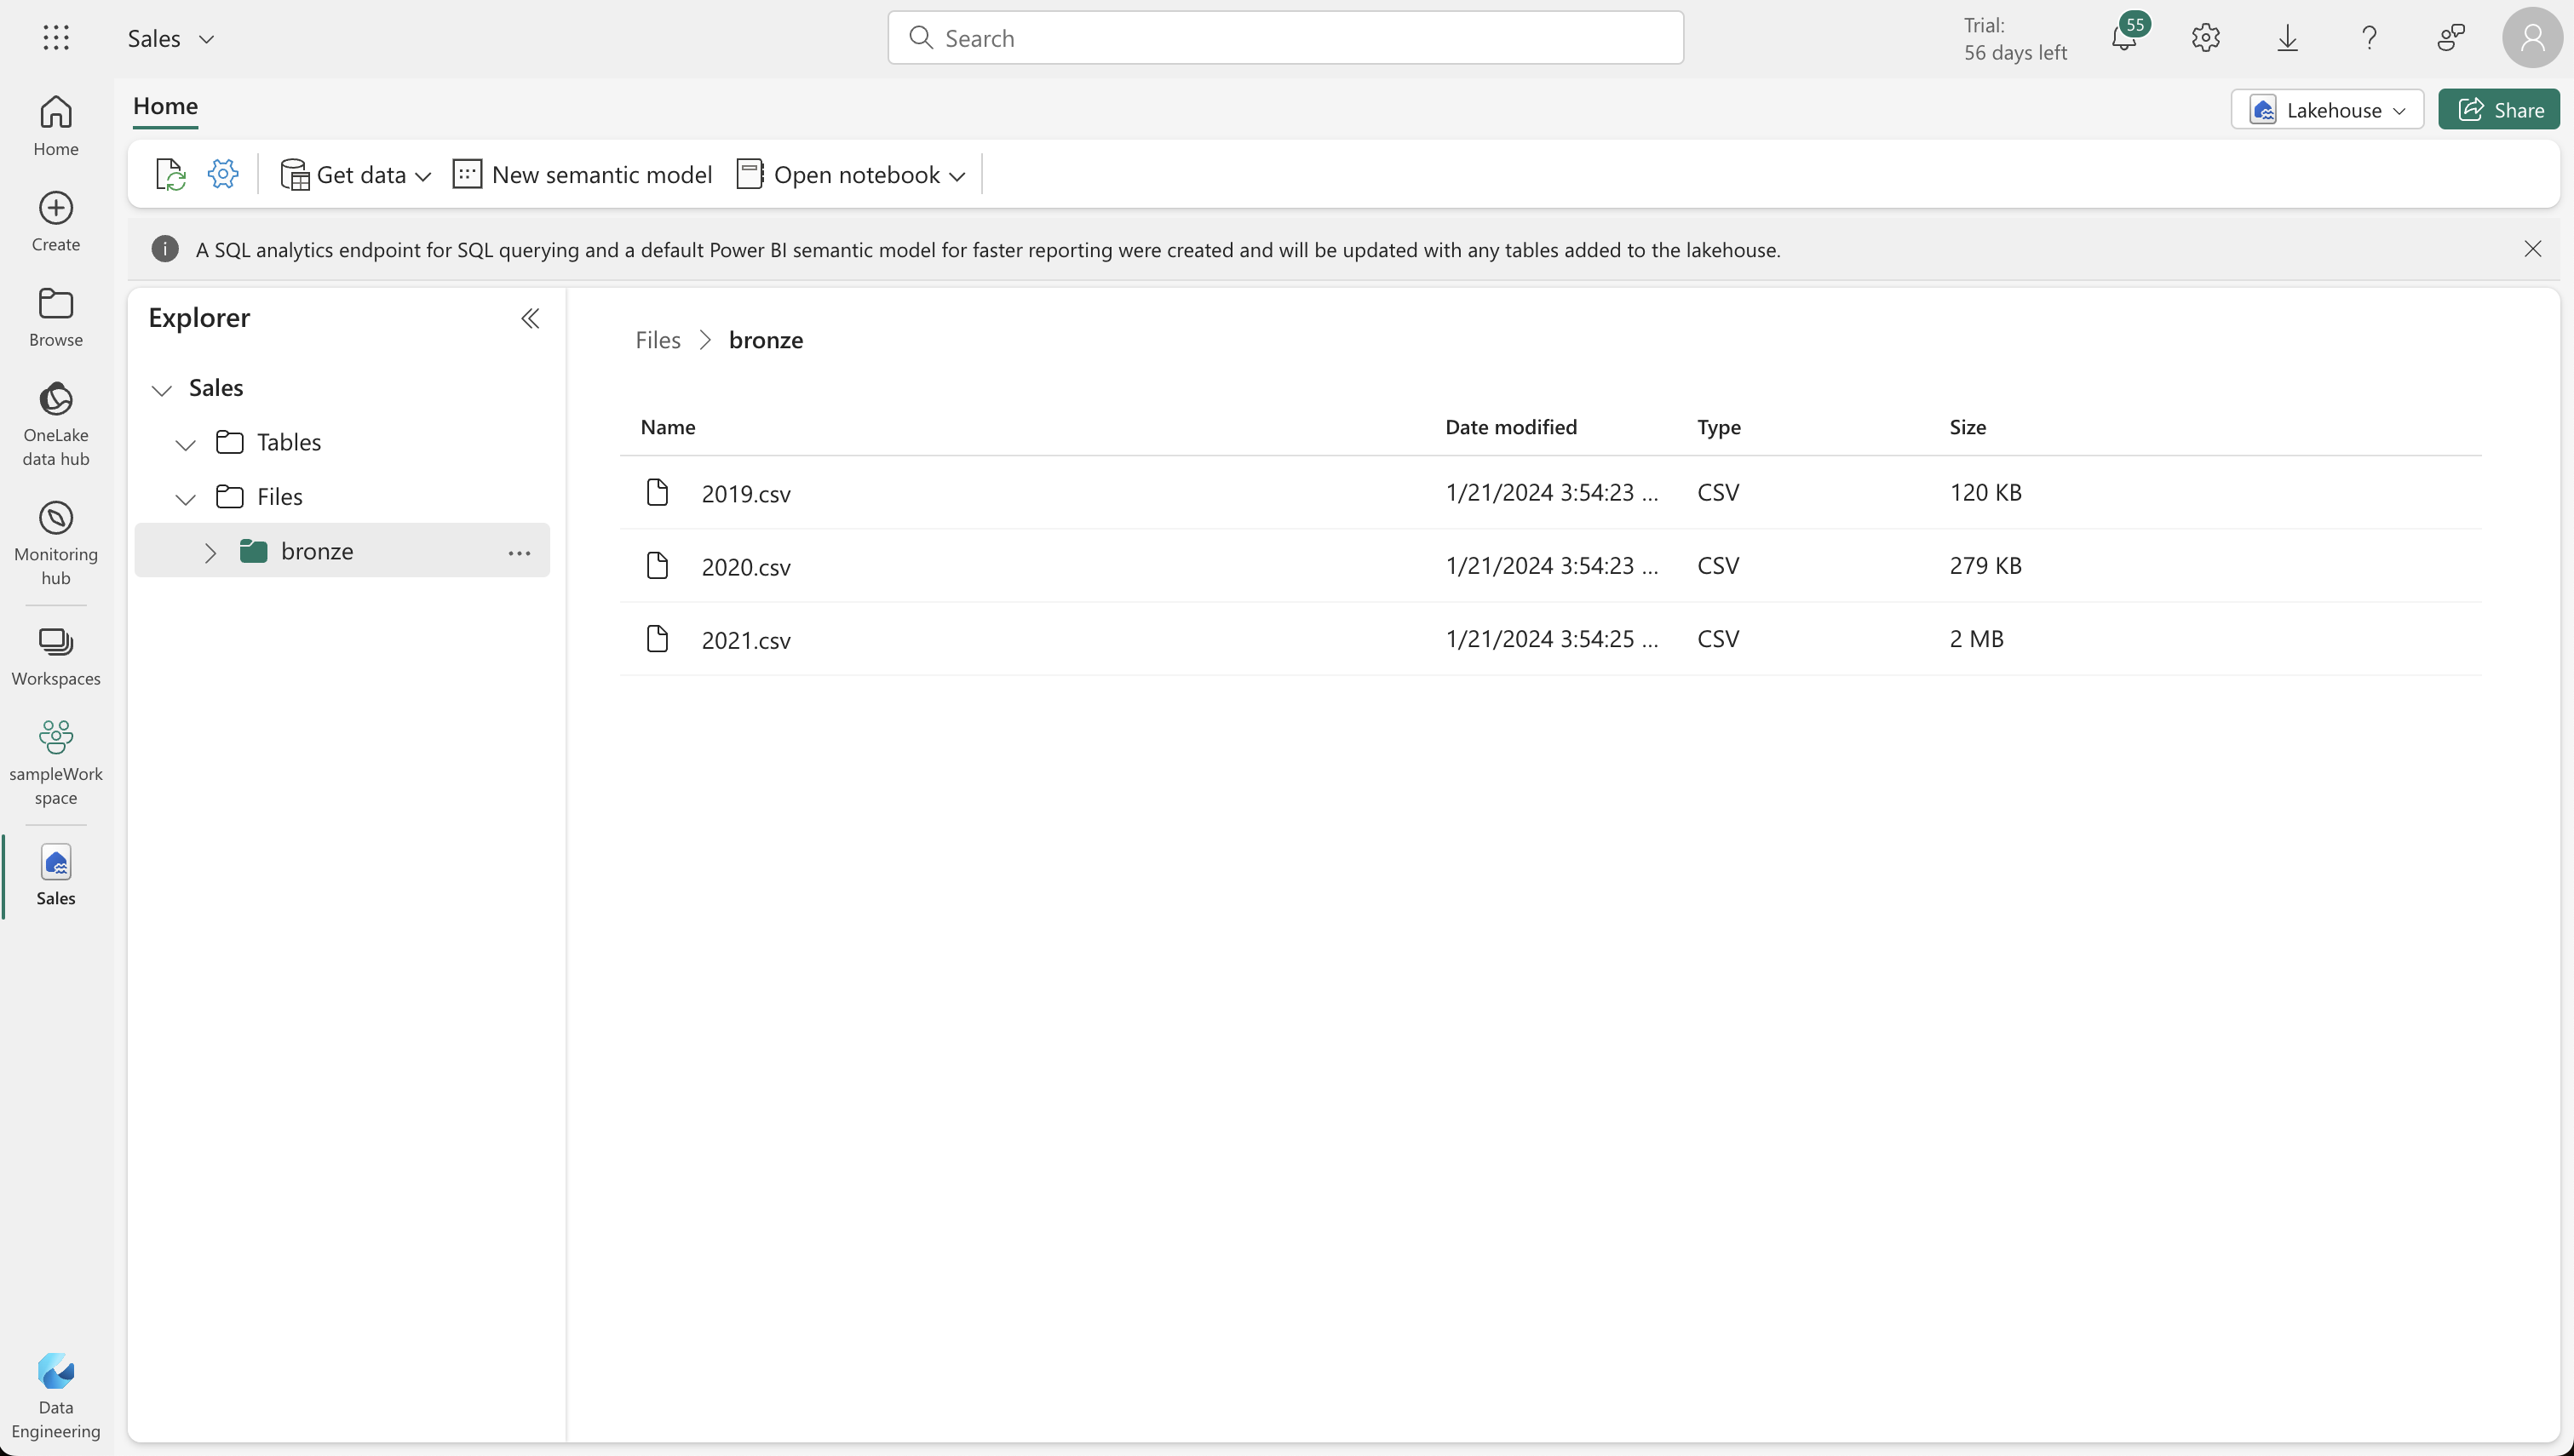
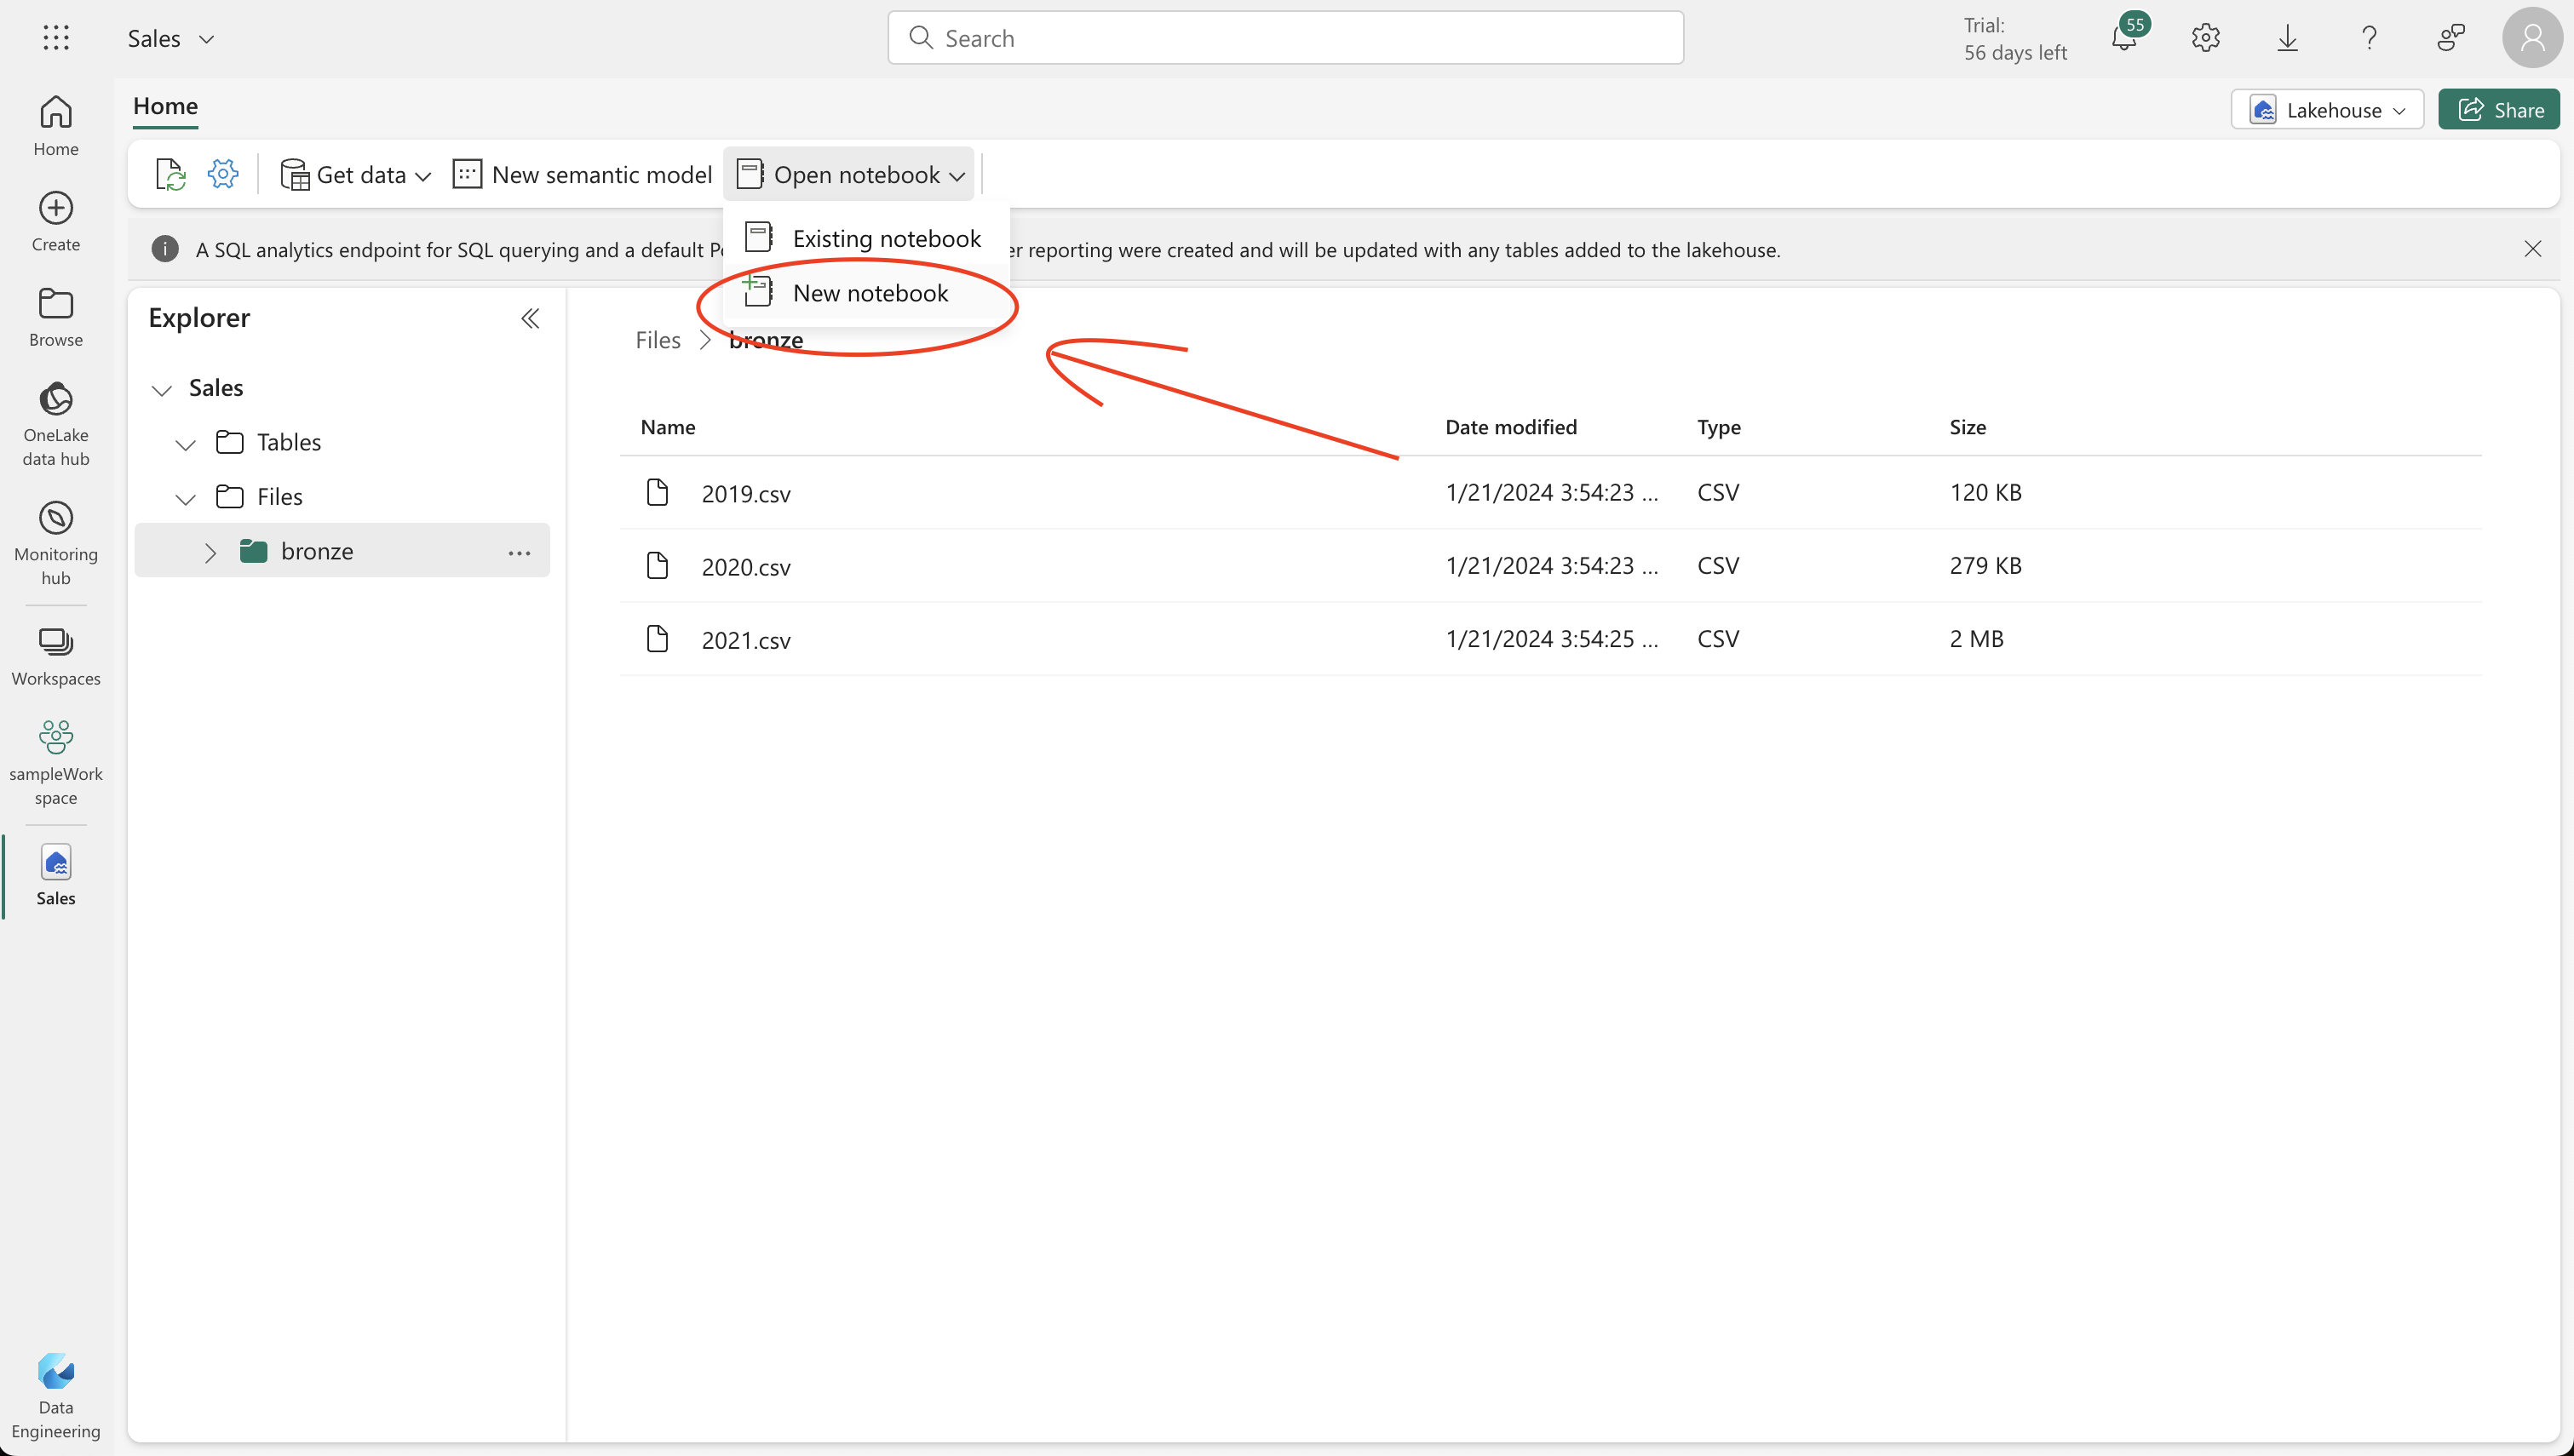
Create a new Lakehouse named ‘Sales’ on the Synapse Data Engineering home page. Download the required data files from the provided GitHub link and upload them to a new ‘bronze’ folder in your lakehouse. These files will include sales data for 2019, 2020, and 2021.
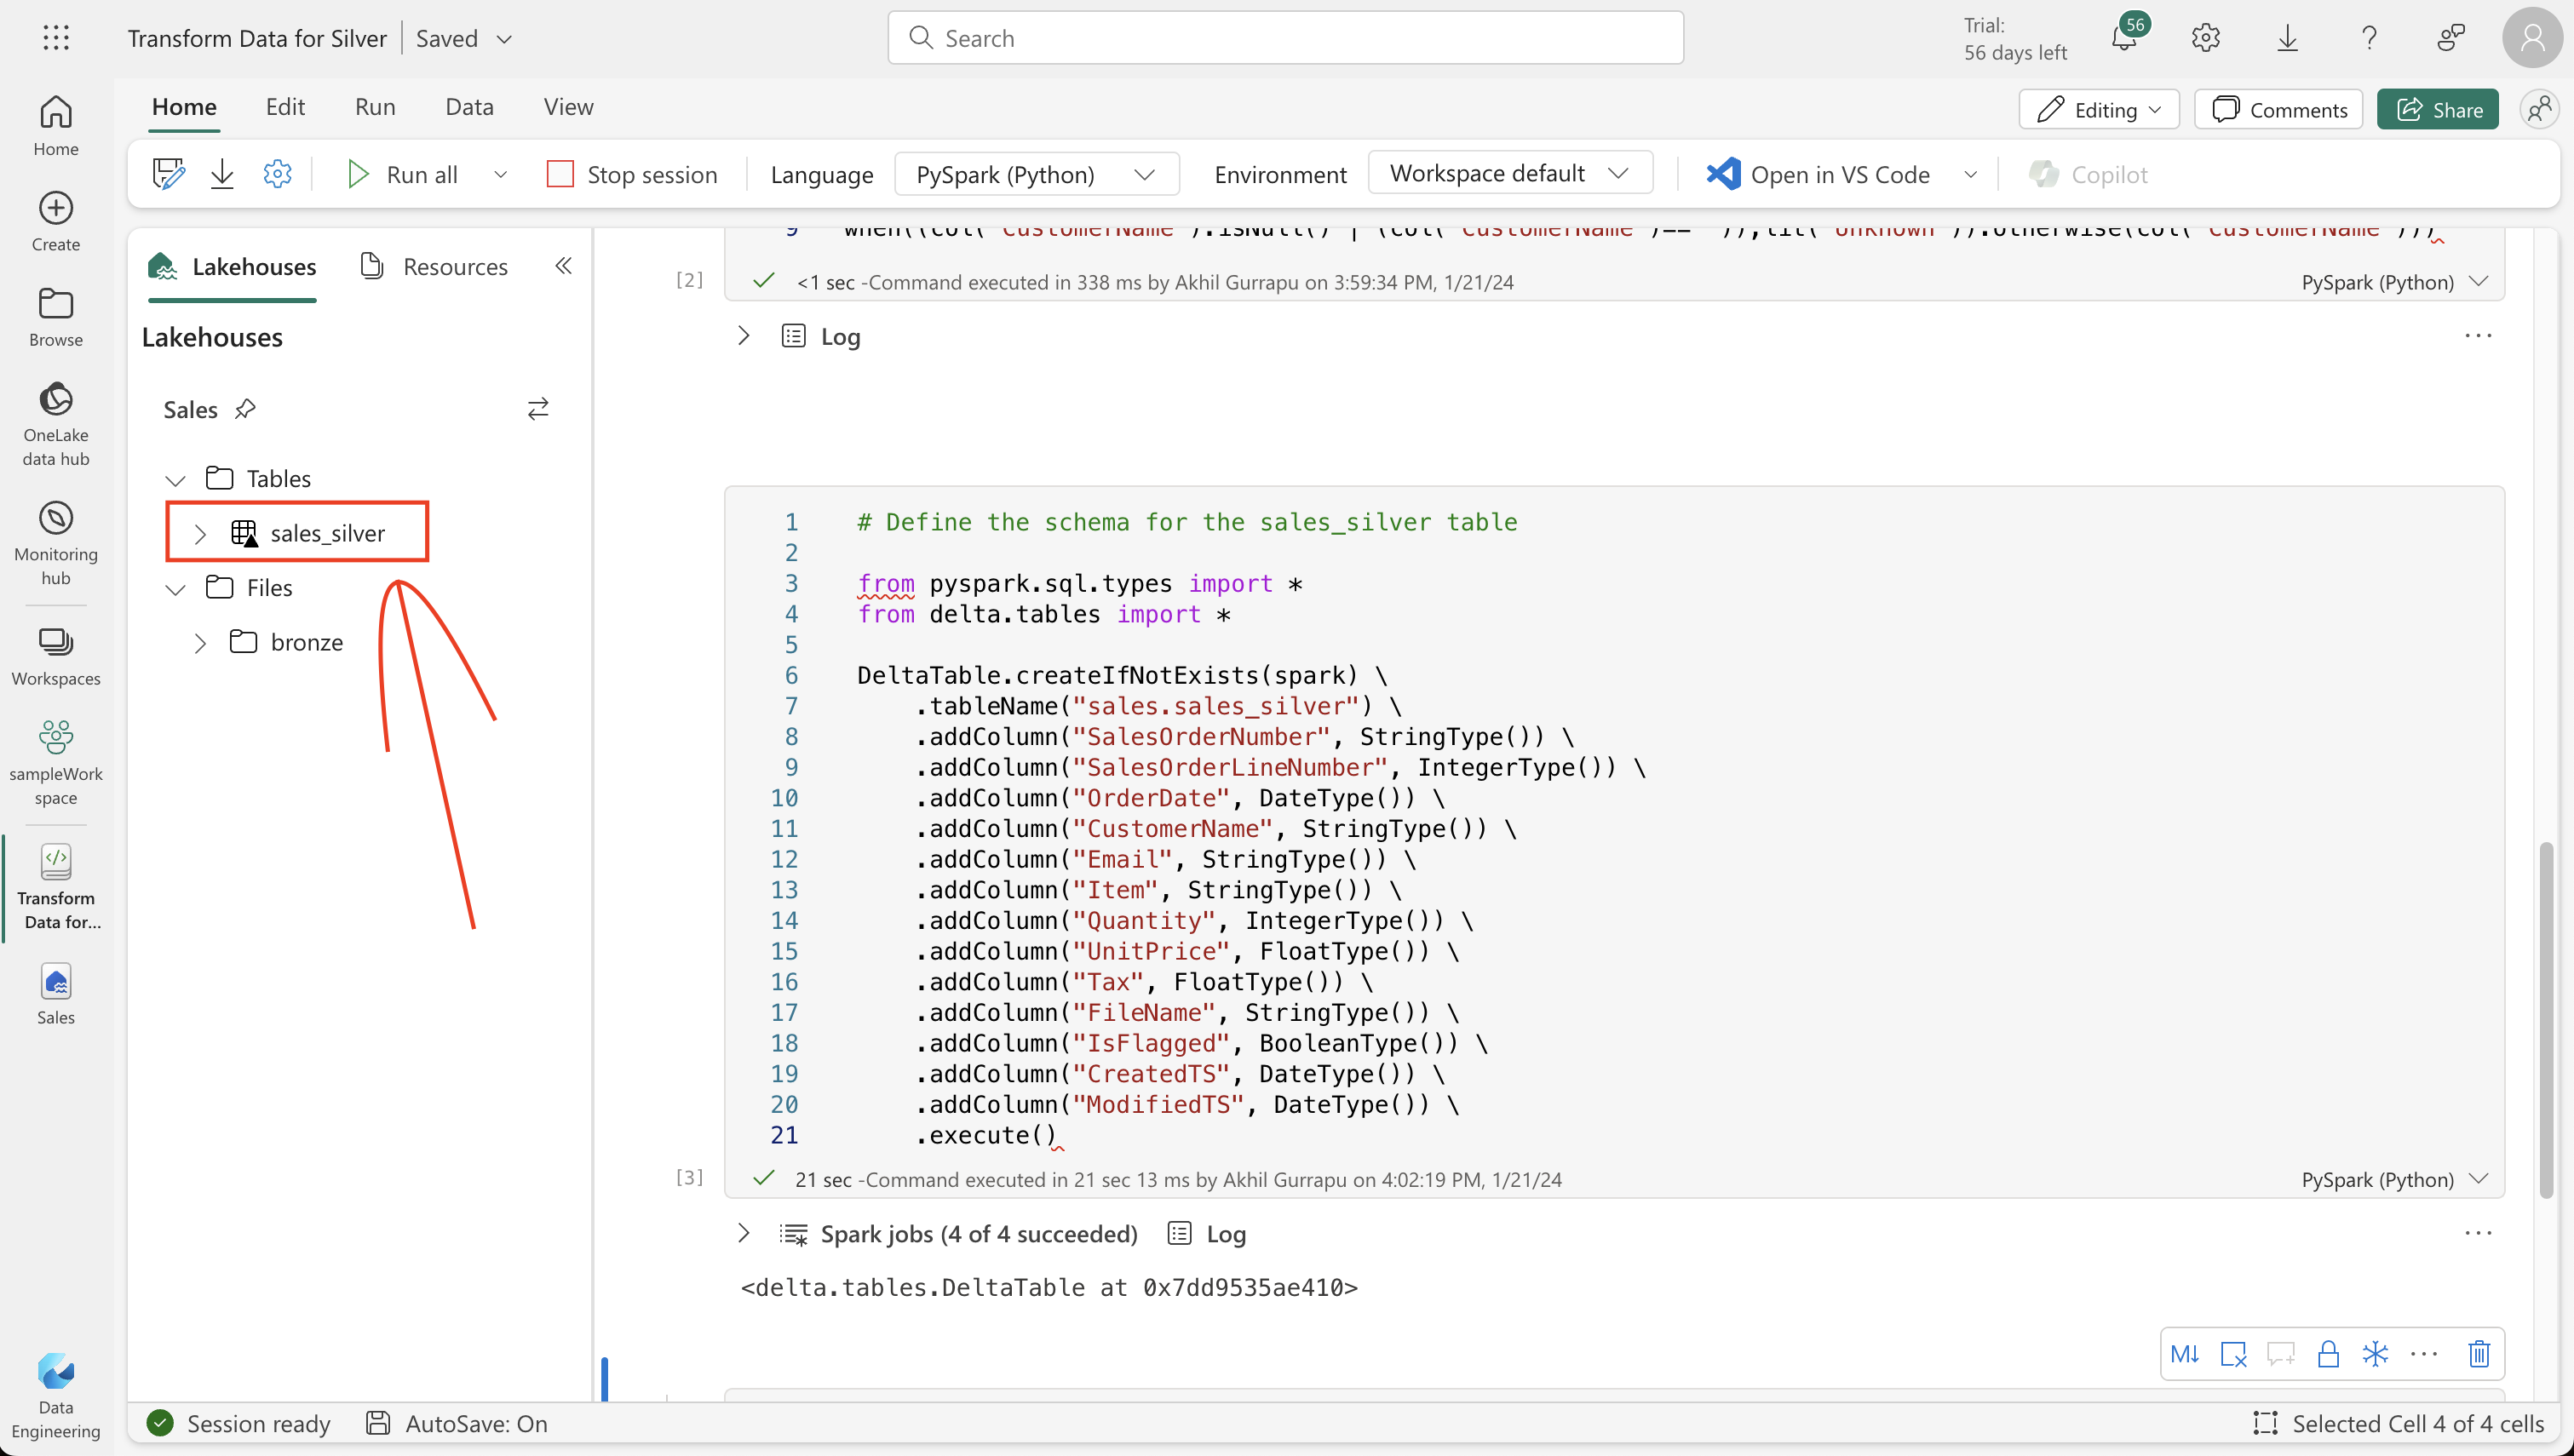
3. Transforming Data for the Silver Delta Table
Use a notebook to transform the data from the bronze layer. Load the data into a Spark dataframe, perform data validation and cleanup, and then define the schema for the silver layer’s Delta table. Run the necessary PySpark and SQL codes to achieve this.
Transform data and load to silver Delta table
- Now that we have some data in the bronze layer of your lakehouse, you can use a notebook to transform the data and load it to a delta table in the silver layer.
 from pyspark.sql.types import *

 # Create the schema for the table
 orderSchema = StructType([
     StructField("SalesOrderNumber", StringType()),
     StructField("SalesOrderLineNumber", IntegerType()),
     StructField("OrderDate", DateType()),
     StructField("CustomerName", StringType()),
     StructField("Email", StringType()),
     StructField("Item", StringType()),
     StructField("Quantity", IntegerType()),
     StructField("UnitPrice", FloatType()),
     StructField("Tax", FloatType())
     ])

 # Import all files from bronze folder of lakehouse
 df = spark.read.format("csv").option("header", "true").schema(orderSchema).load("Files/bronze/*.csv")

 # Display the first 10 rows of the dataframe to preview your data
 display(df.head(5))
StatementMeta(, 9badc348-ff9e-438e-91b2-c06ee345f00c, 4, Finished, Available)
| SalesOrderNumber | SalesOrderLineNumber | OrderDate | CustomerName | Email | Item | Quantity | UnitPrice | Tax |
|-------------------|-----------------------|------------|----------------|-----------------------------|-------------------------|----------|-------------------|-------------------|
| SO49172 | 1 | 2021-01-01 | Brian Howard | brian23@adventure-works.com | Road-250 Red, 44 | 1 | 2443.35009765625 | 195.46800231933594 |
| SO49173 | 1 | 2021-01-01 | Linda Alvarez | linda19@adventure-works.com | Mountain-200 Silver, 38 | 1 | 2071.419677734375 | 165.71359252929688 |
| SO49174 | 1 | 2021-01-01 | Gina Hernandez | gina4@adventure-works.com | Mountain-200 Silver, 42 | 1 | 2071.419677734375 | 165.71359252929688 |
| SO49178 | 1 | 2021-01-01 | Beth Ruiz | beth4@adventure-works.com | Road-550-W Yellow, 44 | 1 | 1000.4375 | 80.03500366210938 |
| SO49179 | 1 | 2021-01-01 | Evan Ward | evan13@adventure-works.com | Road-550-W Yellow, 38 | 1 | 1000.4375 | 80.03500366210938 |
 from pyspark.sql.functions import when, lit, col, current_timestamp, input_file_name

 # Add columns IsFlagged, CreatedTS and ModifiedTS
 df = df.withColumn("FileName", input_file_name()) \
     .withColumn("IsFlagged", when(col("OrderDate") < '2019-08-01',True).otherwise(False)) \
     .withColumn("CreatedTS", current_timestamp()).withColumn("ModifiedTS", current_timestamp())

 # Update CustomerName to "Unknown" if CustomerName null or empty
 df = df.withColumn("CustomerName", when((col("CustomerName").isNull() | (col("CustomerName")=="")),lit("Unknown")).otherwise(col("CustomerName")))
StatementMeta(, 9badc348-ff9e-438e-91b2-c06ee345f00c, 5, Finished, Available)
Next, you’ll define the schema for the sales_silver table in the sales database using Delta Lake format. Create a new code block and add the following code to the cell:
 # Define the schema for the sales_silver table

 from pyspark.sql.types import *
 from delta.tables import *

 DeltaTable.createIfNotExists(spark) \
     .tableName("sales.sales_silver") \
     .addColumn("SalesOrderNumber", StringType()) \
     .addColumn("SalesOrderLineNumber", IntegerType()) \
     .addColumn("OrderDate", DateType()) \
     .addColumn("CustomerName", StringType()) \
     .addColumn("Email", StringType()) \
     .addColumn("Item", StringType()) \
     .addColumn("Quantity", IntegerType()) \
     .addColumn("UnitPrice", FloatType()) \
     .addColumn("Tax", FloatType()) \
     .addColumn("FileName", StringType()) \
     .addColumn("IsFlagged", BooleanType()) \
     .addColumn("CreatedTS", DateType()) \
     .addColumn("ModifiedTS", DateType()) \
     .execute()
StatementMeta(, 9badc348-ff9e-438e-91b2-c06ee345f00c, 12, Finished, Available)
<delta.tables.DeltaTable at 0x74a7ce7b87c0>
# Update existing records and insert new ones based on a condition defined by the columns SalesOrderNumber, OrderDate, CustomerName, and Item.

from delta.tables import *

deltaTable = DeltaTable.forPath(spark, 'Tables/sales_silver')

dfUpdates = df

deltaTable.alias('silver') \
  .merge(
    dfUpdates.alias('updates'),
    'silver.SalesOrderNumber = updates.SalesOrderNumber and silver.OrderDate = updates.OrderDate and silver.CustomerName = updates.CustomerName and silver.Item = updates.Item'
  ) \
   .whenMatchedUpdate(set =
    {

    }
  ) \
 .whenNotMatchedInsert(values =
    {
      "SalesOrderNumber": "updates.SalesOrderNumber",
      "SalesOrderLineNumber": "updates.SalesOrderLineNumber",
      "OrderDate": "updates.OrderDate",
      "CustomerName": "updates.CustomerName",
      "Email": "updates.Email",
      "Item": "updates.Item",
      "Quantity": "updates.Quantity",
      "UnitPrice": "updates.UnitPrice",
      "Tax": "updates.Tax",
      "FileName": "updates.FileName",
      "IsFlagged": "updates.IsFlagged",
      "CreatedTS": "updates.CreatedTS",
      "ModifiedTS": "updates.ModifiedTS"
    }
  ) \
  .execute()
StatementMeta(, 9badc348-ff9e-438e-91b2-c06ee345f00c, 13, Finished, Available)
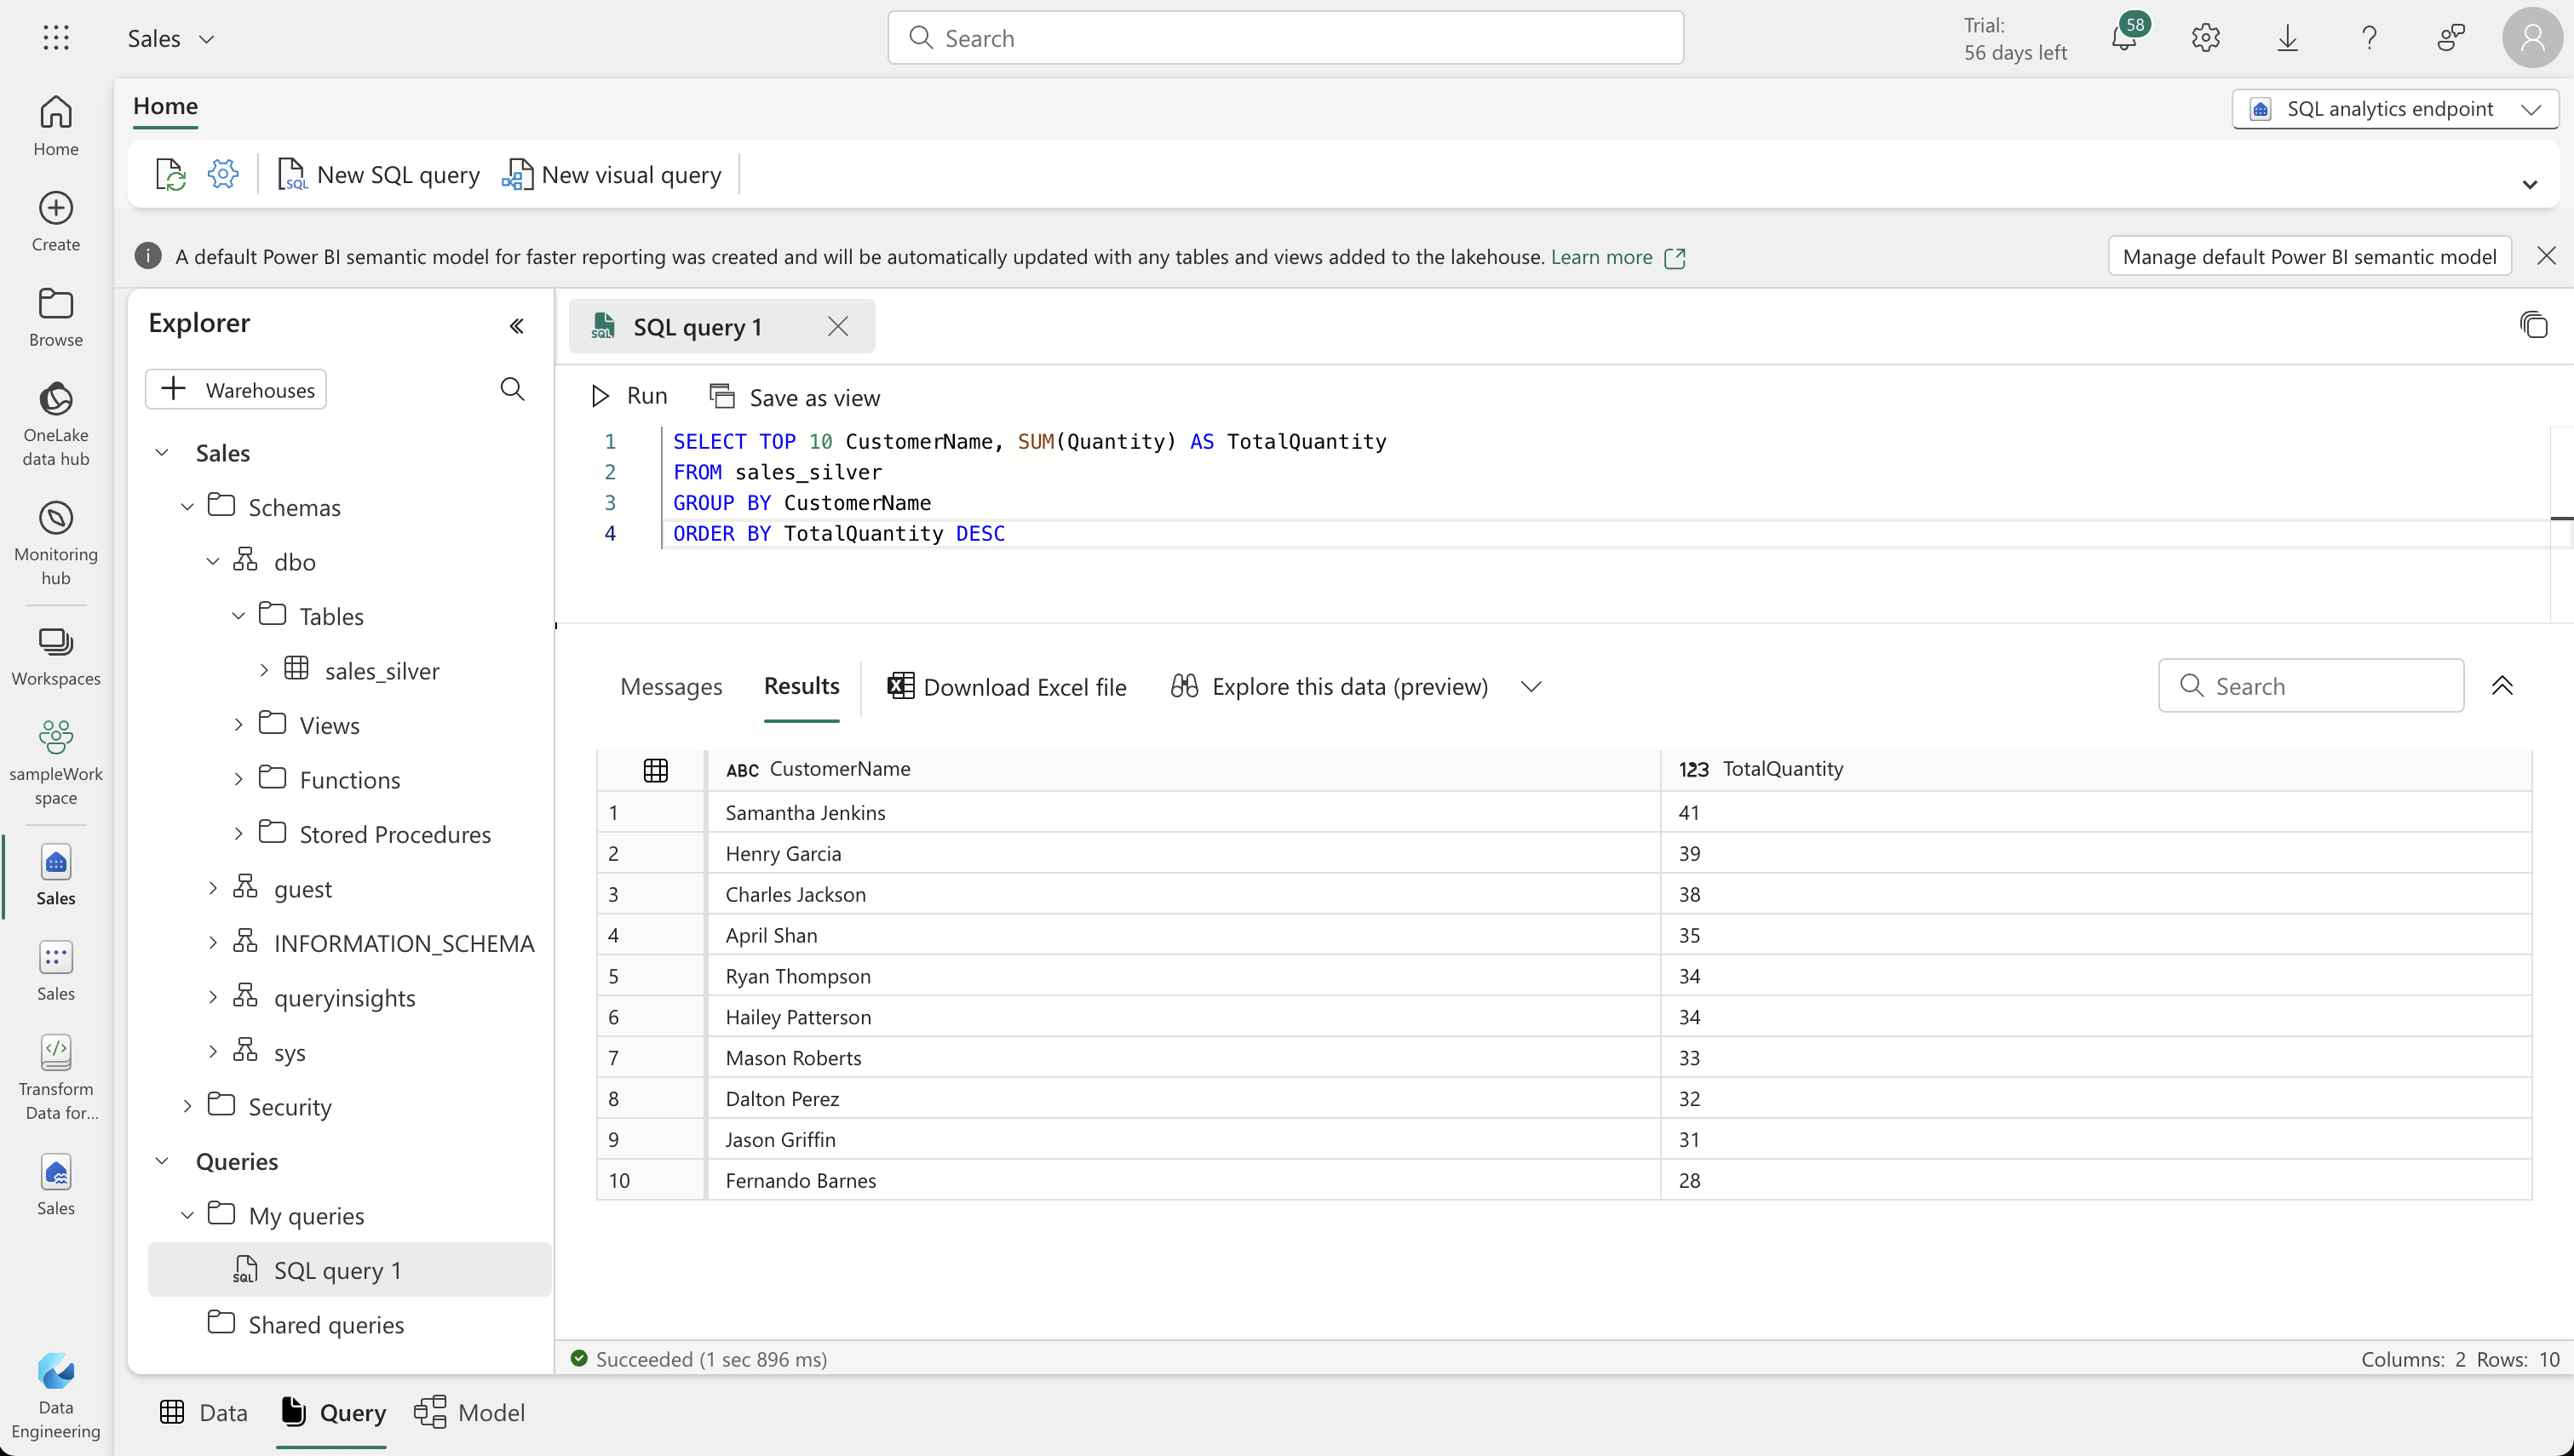
4. Exploring Data in the Silver Layer
Utilize the SQL endpoint in Fabric for basic data analysis. Run SQL queries to understand sales trends and customer behaviors. This step is crucial for gaining insights and preparing data for further transformation.
5. Preparing the Gold Layer
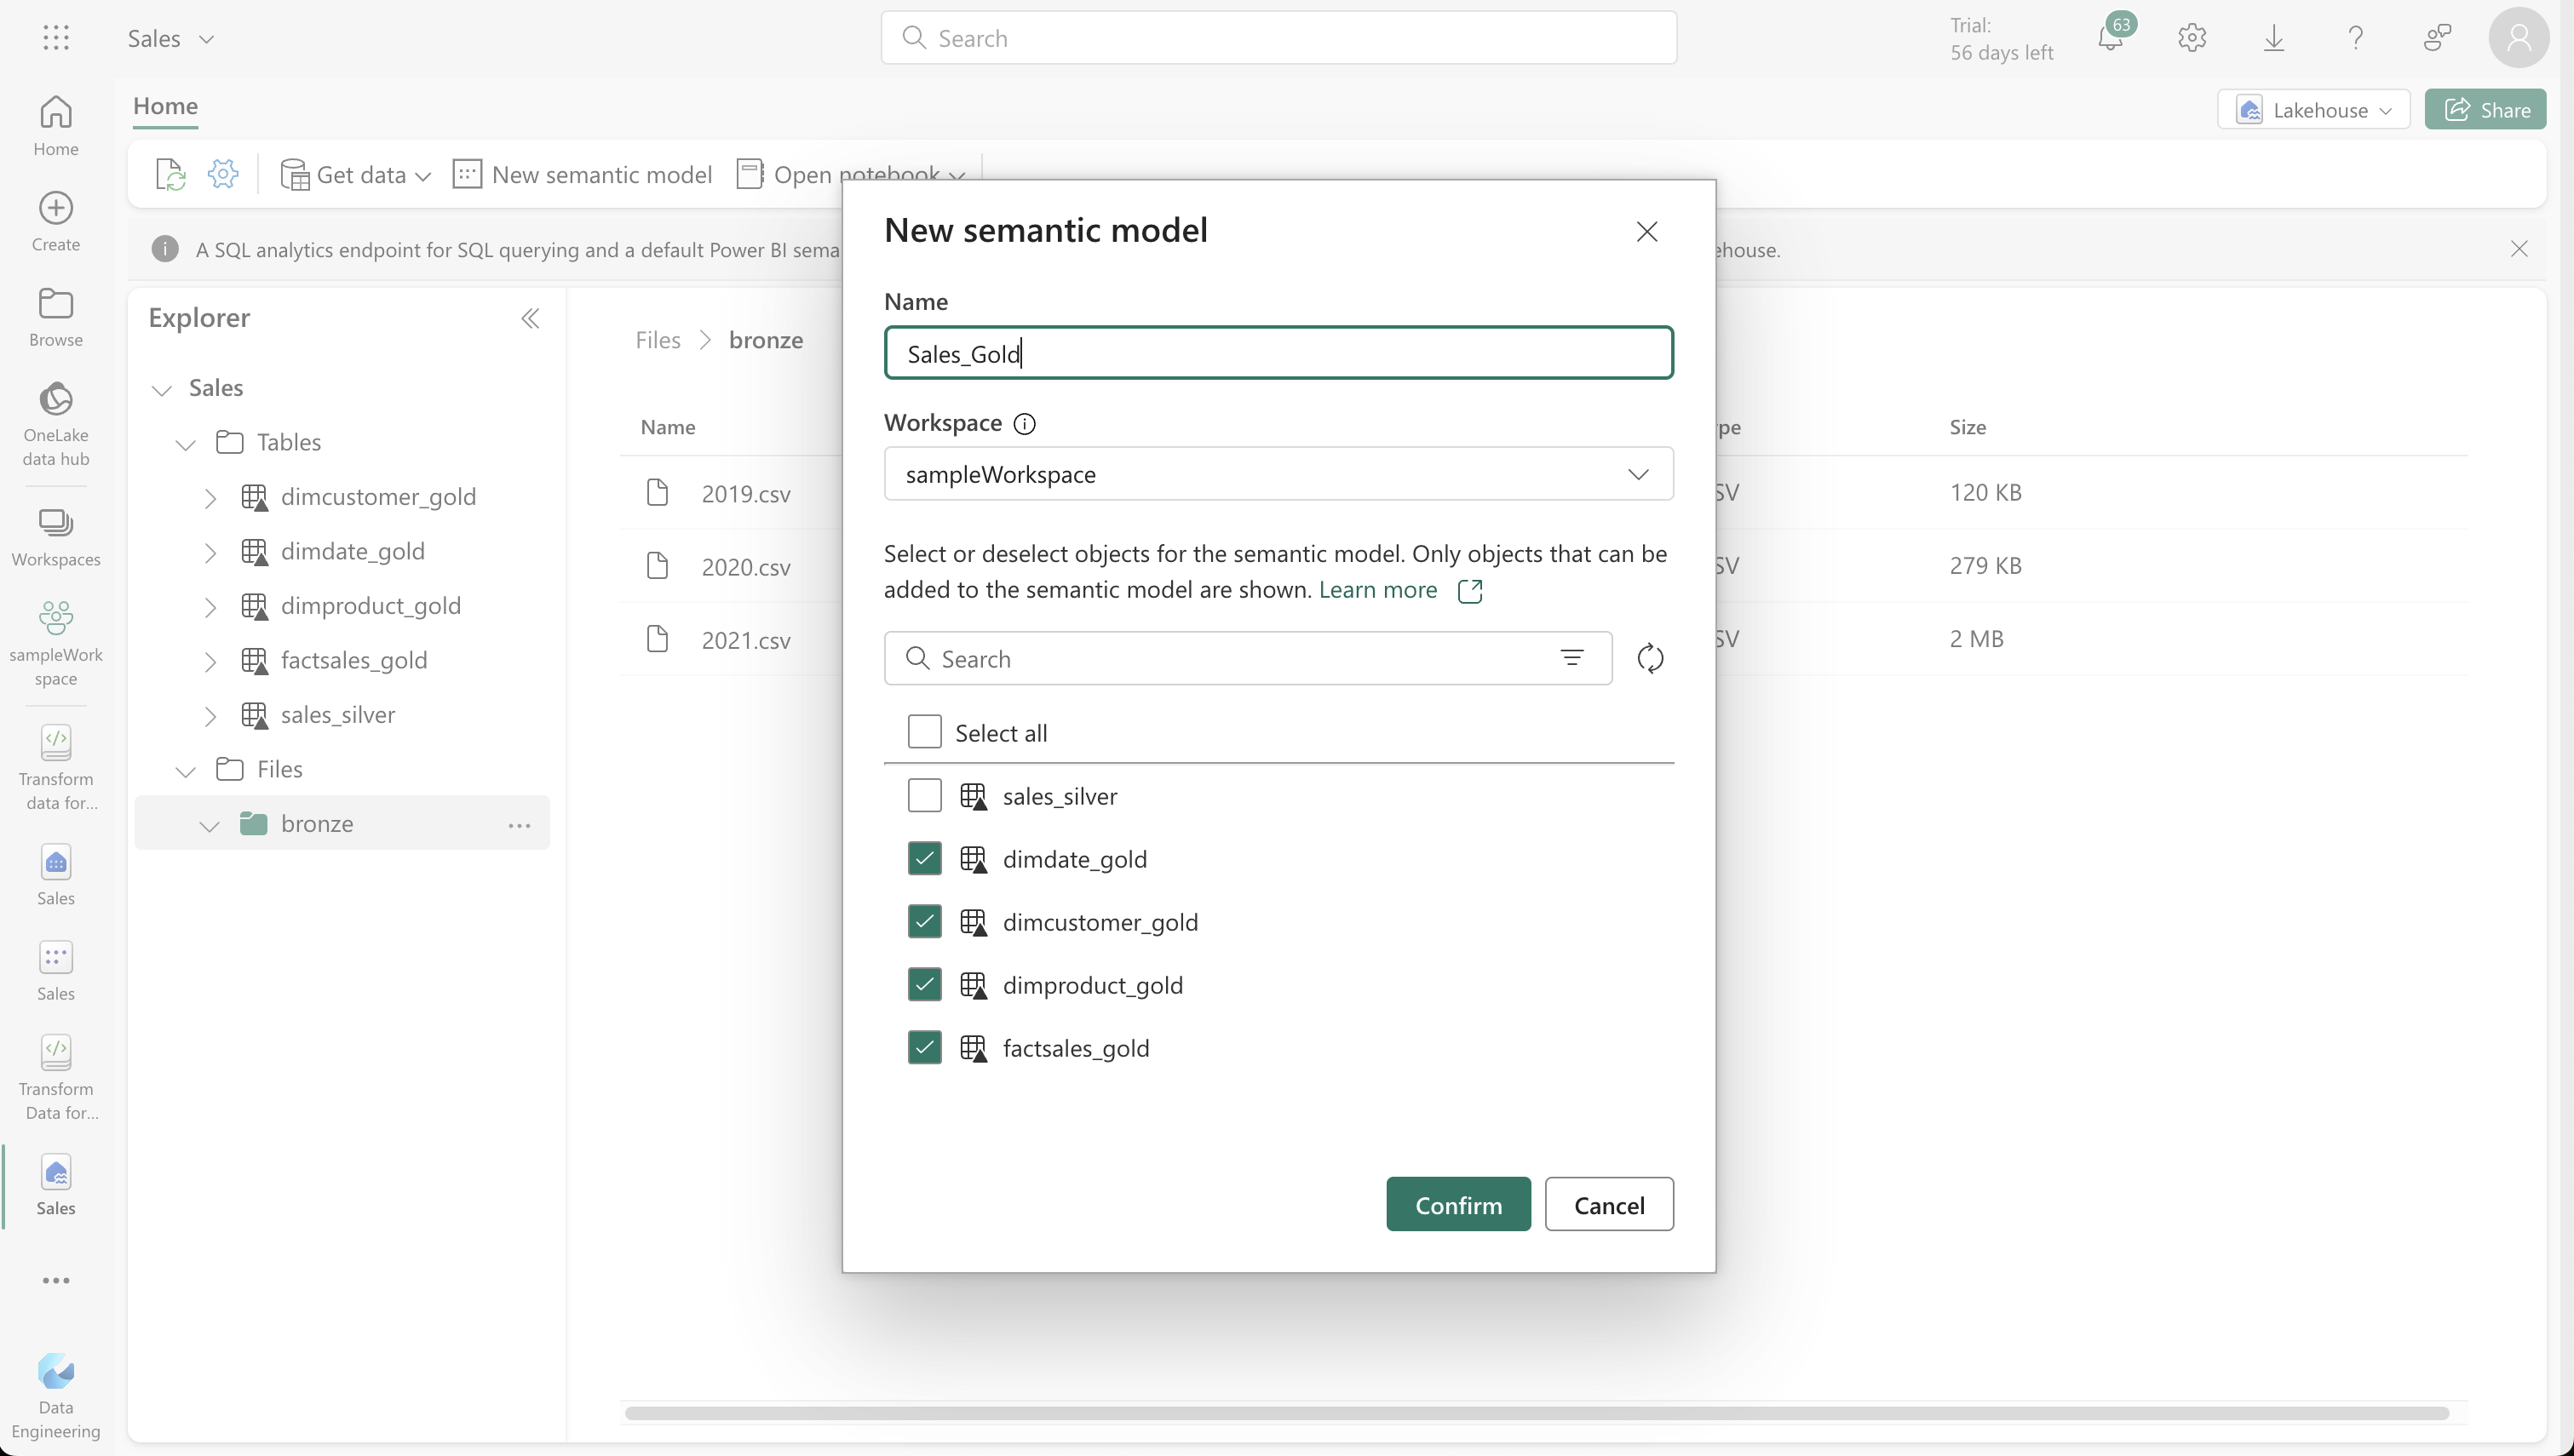
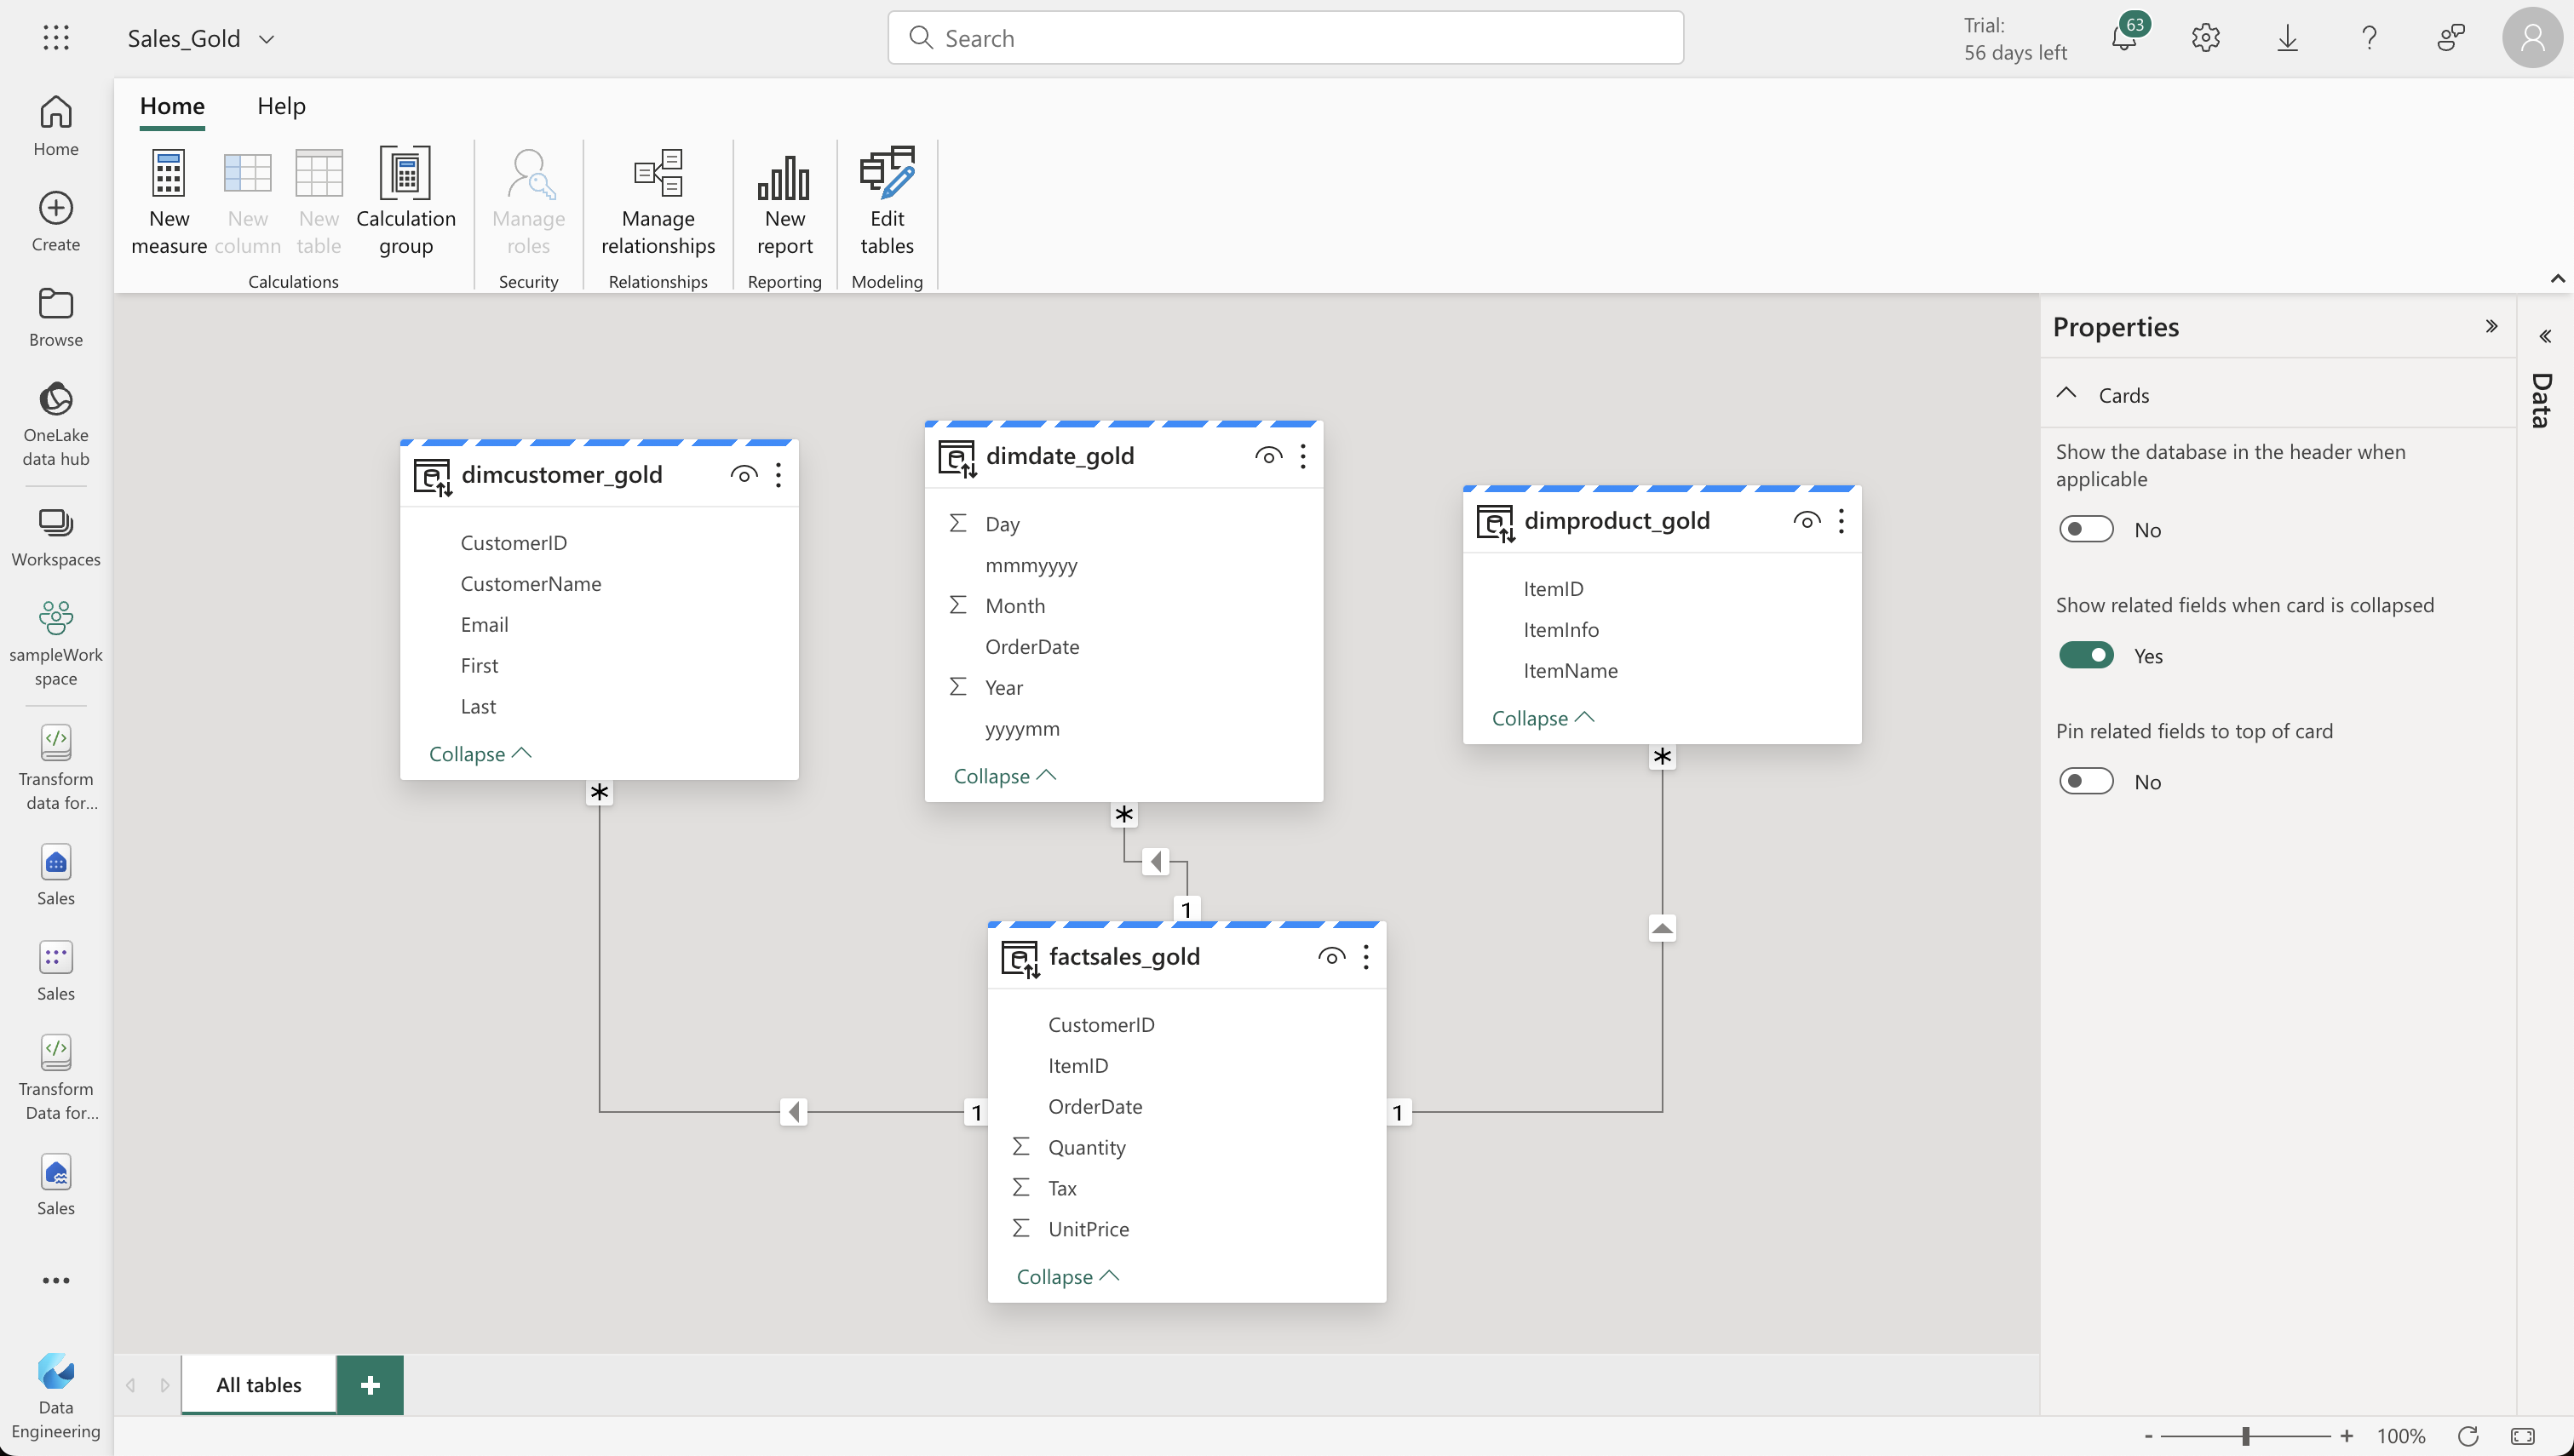
Now, transform the data from the silver layer and model it into a star schema for the gold Delta tables. Create new notebooks for this purpose, focusing on building dimensions for dates, customers, and products. Ensure to create unique IDs and perform upsert operations for updating and inserting records.
Transform data for gold layer
-
You have successfully taken data from your bronze layer, transformed it, and loaded it into a silver Delta table. Now you’ll use a new notebook to transform the data further, model it into a star schema, and load it into gold Delta tables.
-
Note that you could have done all of this in a single notebook, but for the purposes of this exercise you’re using separate notebooks to demonstrate the process of transforming data from bronze to silver and then from silver to gold. This can help with debugging, troubleshooting, and reuse.
-
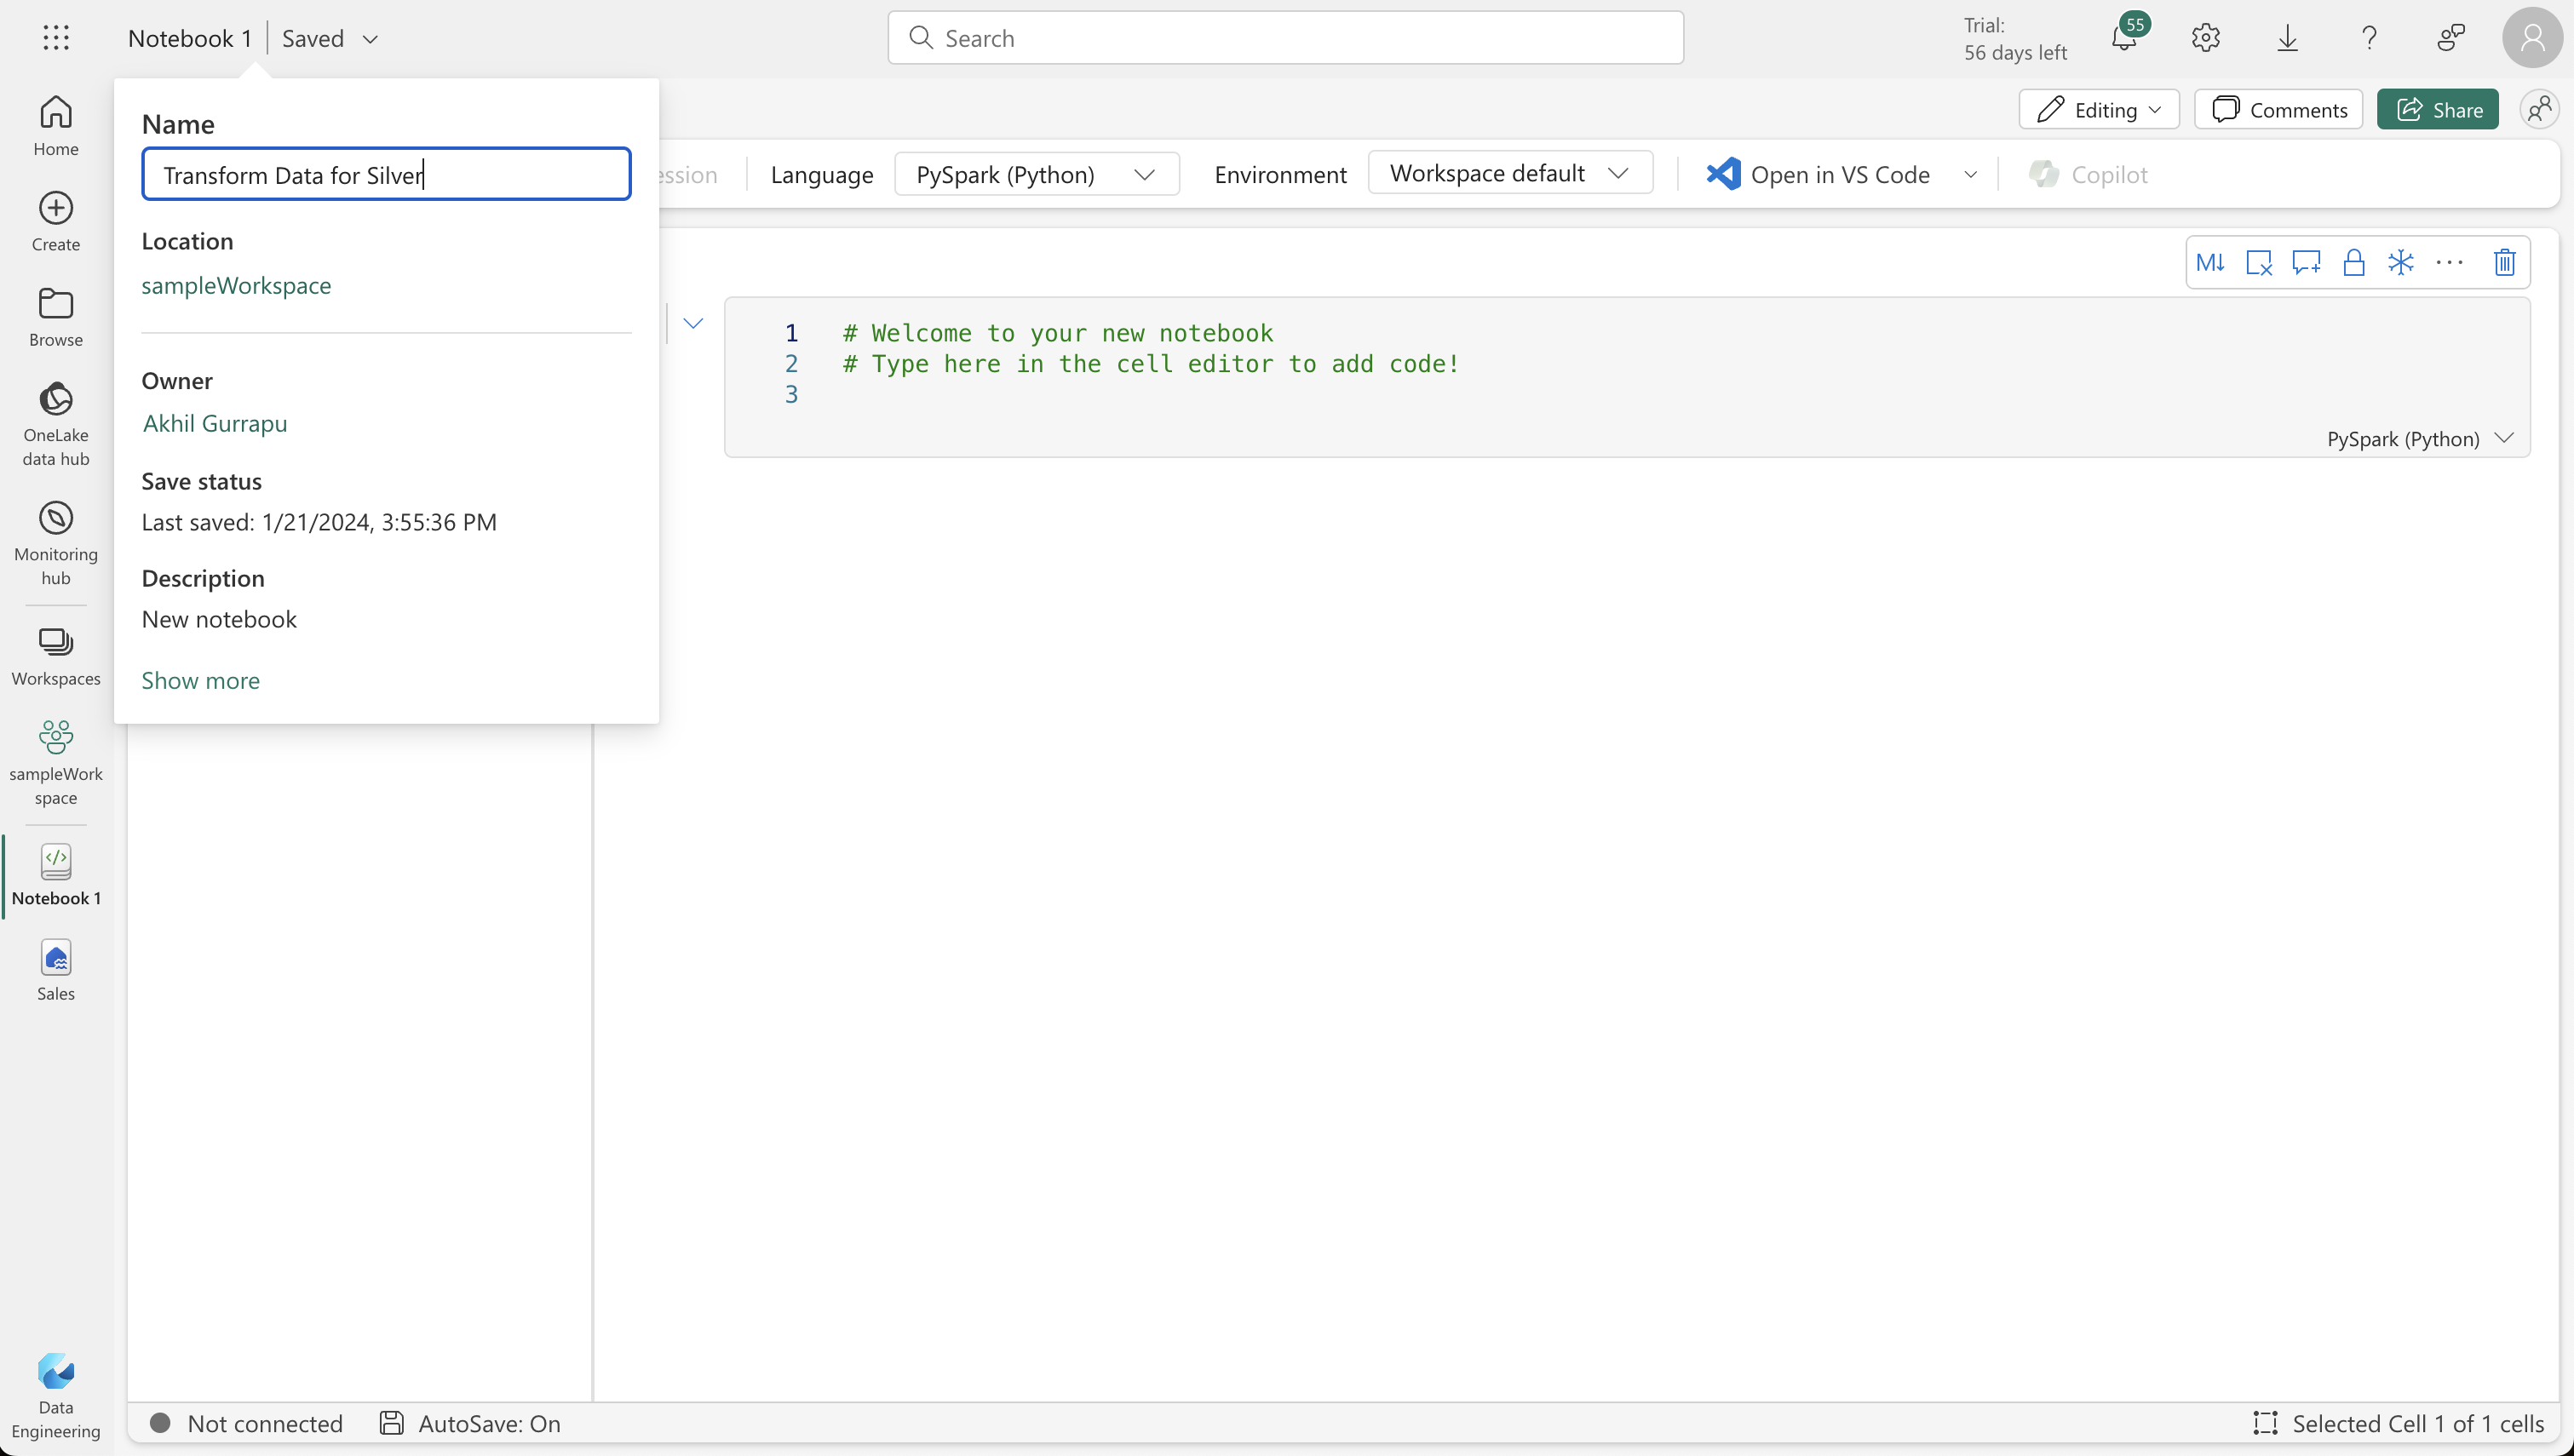
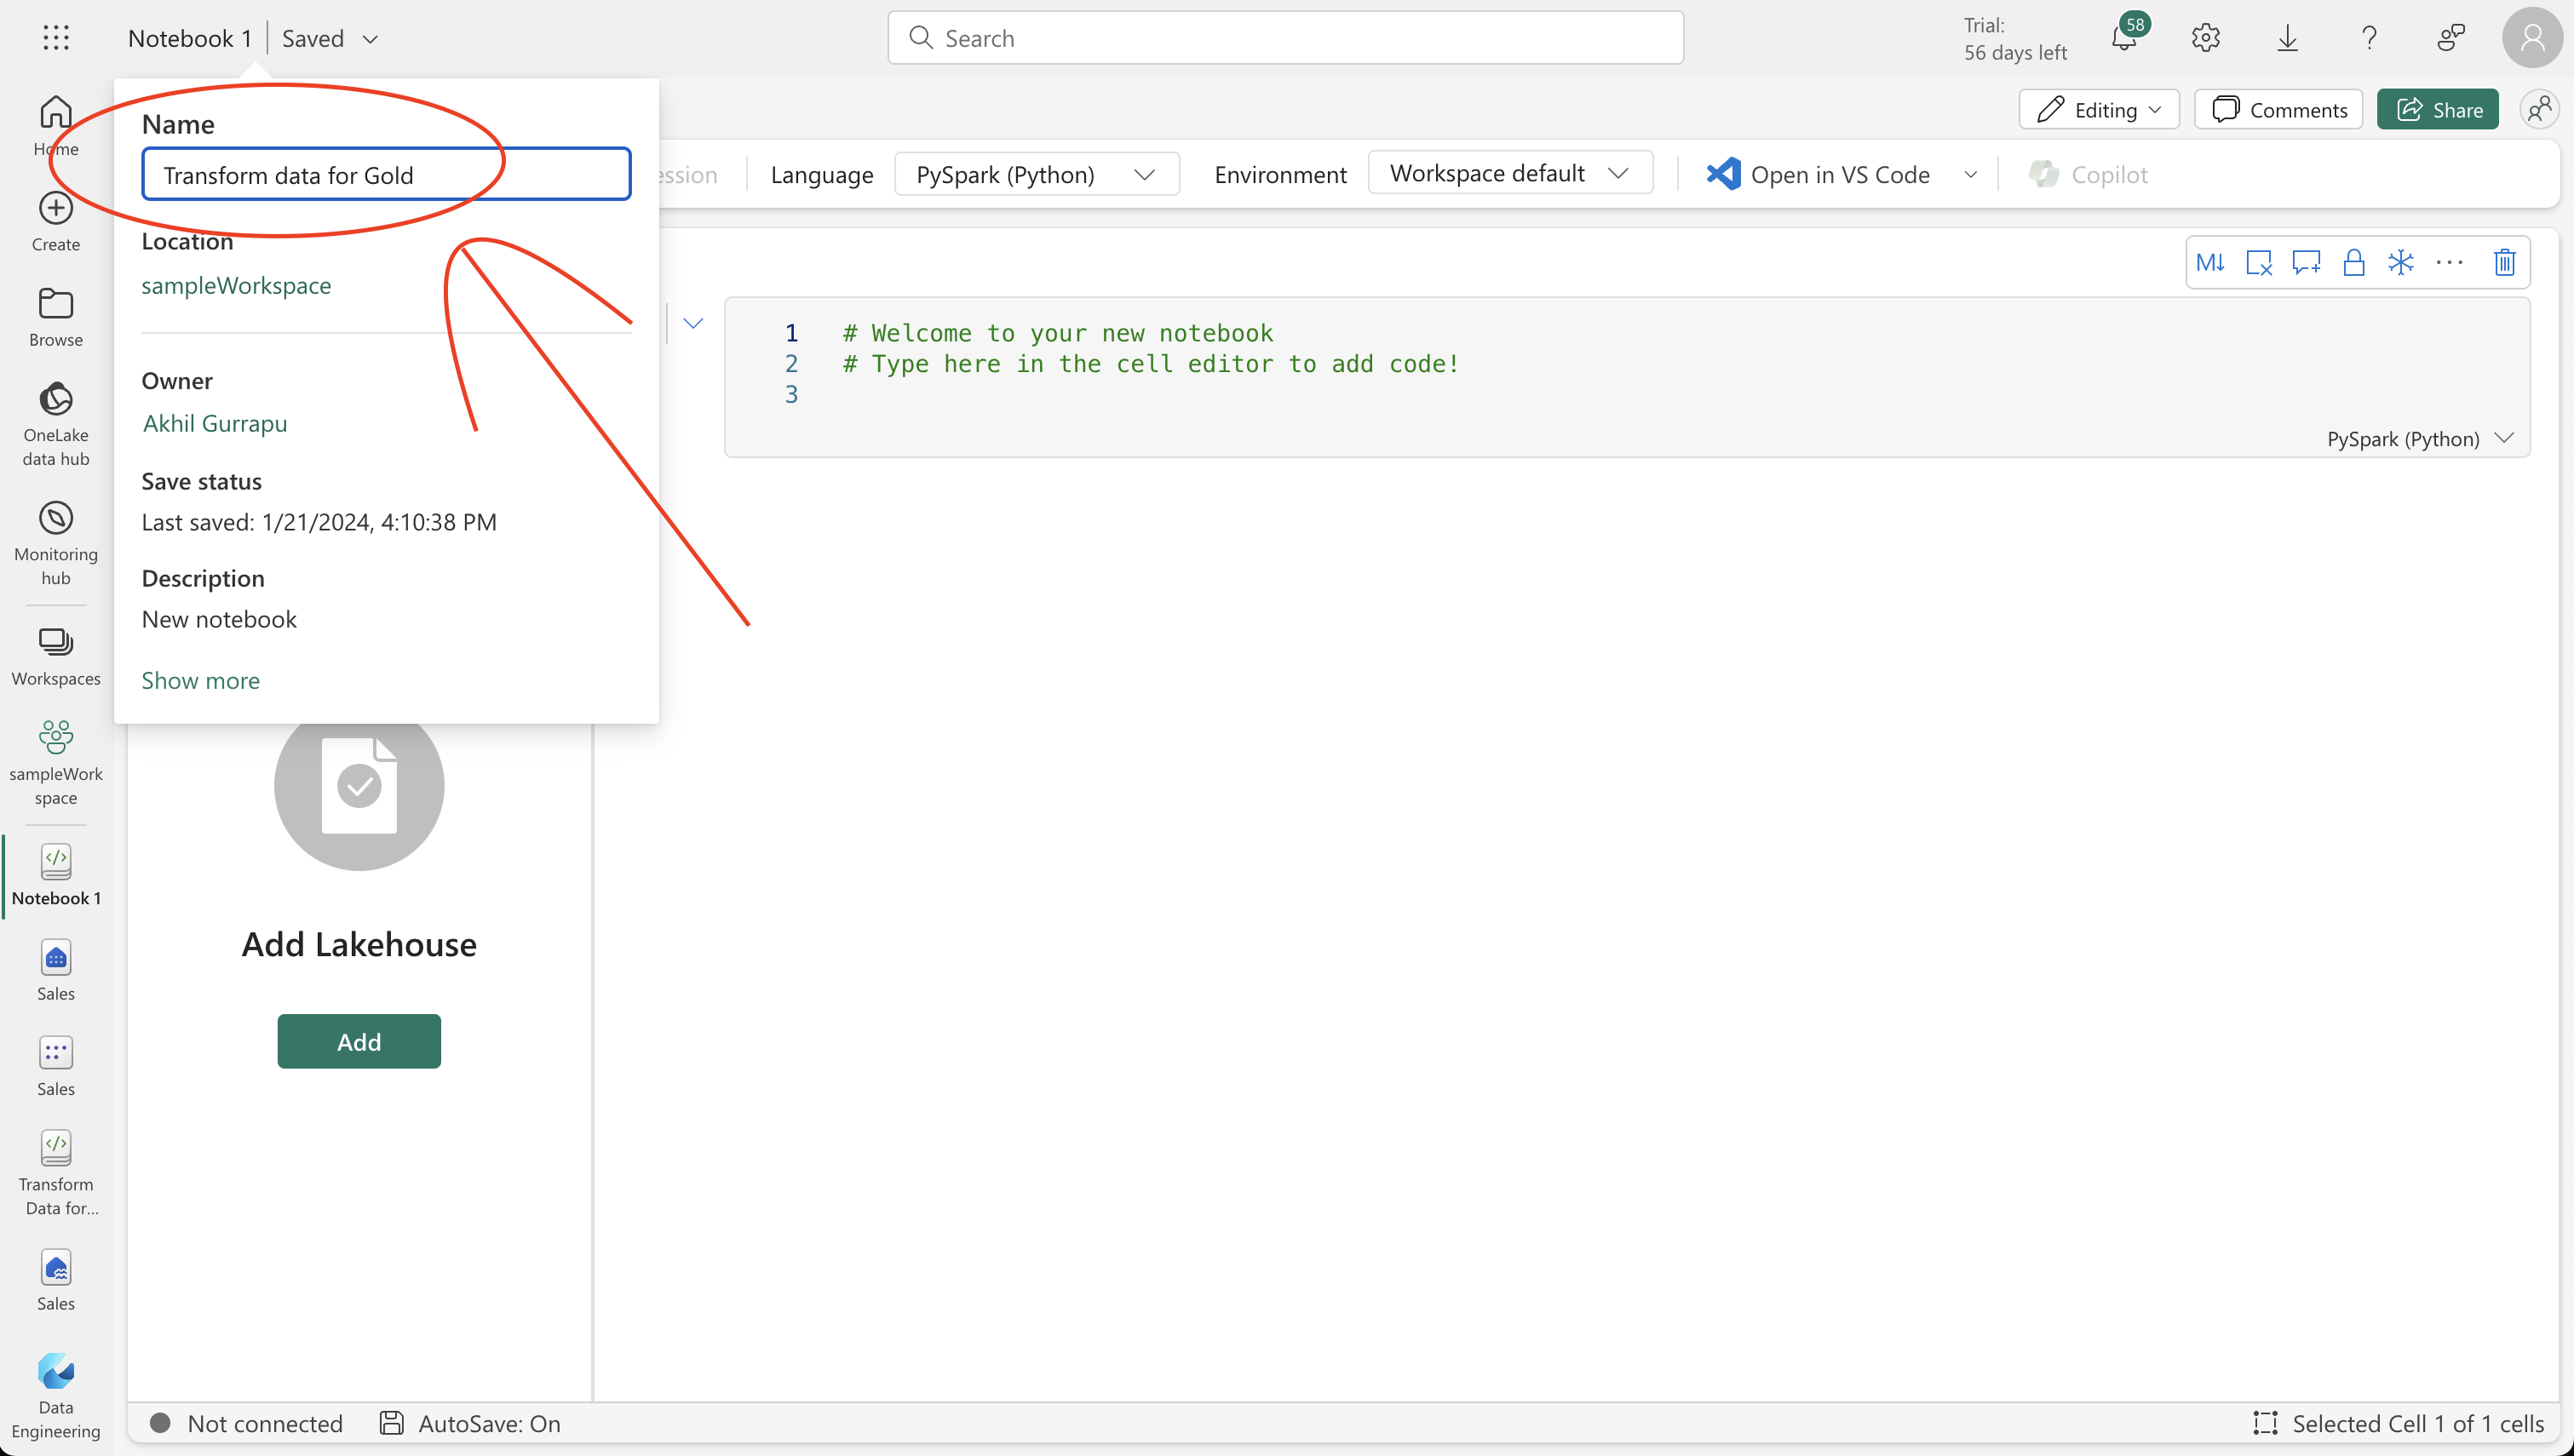
Return to the Data Engineering home page and create a new notebook called Transform data for Gold.
-
In the lakehouse explorer pane, add your Sales lakehouse by selecting Add and then selecting the Sales lakehouse you created earlier. You should see the sales_silver table listed in the Tables section of the explorer pane.
-
In the existing code block, remove the boilerplate text and add the following code to load data to your dataframe and start building out your star schema, then run it:
 # Load data to the dataframe as a starting point to create the gold layer
 df = spark.read.table("Sales.sales_silver")
StatementMeta(, b3a20ceb-d8f5-406c-9345-c95735936830, 3, Finished, Available)
 from pyspark.sql.types import *
 from delta.tables import*

 # Define the schema for the dimdate_gold table
 DeltaTable.createIfNotExists(spark) \
     .tableName("sales.dimdate_gold") \
     .addColumn("OrderDate", DateType()) \
     .addColumn("Day", IntegerType()) \
     .addColumn("Month", IntegerType()) \
     .addColumn("Year", IntegerType()) \
     .addColumn("mmmyyyy", StringType()) \
     .addColumn("yyyymm", StringType()) \
     .execute()

display(df.head(5))
StatementMeta(, b3a20ceb-d8f5-406c-9345-c95735936830, 5, Finished, Available)
| SalesOrderNumber | SalesOrderLineNumber | OrderDate | CustomerName | Email | Item | Quantity | UnitPrice | Tax | FileLink | IsProcessed | CreatedDate | UpdatedDate |
|-------------------|-----------------------|------------|------------------|-------------------------------|--------------------------|----------|-------------------|--------------------|----------------------------------------------------------------------------------------------------------------------------------------------------|-------------|-------------|-------------|
| SO45417 | 1 | 2020-01-11 | Cole Richardson | cole11@adventure-works.com | Road-150 Red, 62 | 1 | 3578.27001953125 | 286.2615966796875 | abfss://ab3fb9ba-2fa2-4157-8037-21c99df09572@onelake.dfs.fabric.microsoft.com/9b421931-47b1-4094-a925-3a7b2c452773/Files/bronze/2020.csv?version=1705888013498?flength=286129 | false | 2024-01-22 | 2024-01-22 |
| SO45415 | 1 | 2020-01-11 | Morgan Hall | morgan20@adventure-works.com | Road-150 Red, 48 | 1 | 3578.27001953125 | 286.2615966796875 | abfss://ab3fb9ba-2fa2-4157-8037-21c99df09572@onelake.dfs.fabric.microsoft.com/9b421931-47b1-4094-a925-3a7b2c452773/Files/bronze/2020.csv?version=1705888013498?flength=286129 | false | 2024-01-22 | 2024-01-22 |
| SO45411 | 1 | 2020-01-11 | Kayla Rodriguez | kayla19@adventure-works.com | Road-150 Red, 52 | 1 | 3578.27001953125 | 286.2615966796875 | abfss://ab3fb9ba-2fa2-4157-8037-21c99df09572@onelake.dfs.fabric.microsoft.com/9b421931-47b1-4094-a925-3a7b2c452773/Files/bronze/2020.csv?version=1705888013498?flength=286129 | false | 2024-01-22 | 2024-01-22 |
| SO45416 | 1 | 2020-01-11 | Jessica Perry | jessica32@adventure-works.com | Road-150 Red, 62 | 1 | 3578.27001953125 | 286.2615966796875 | abfss://ab3fb9ba-2fa2-4157-8037-21c99df09572@onelake.dfs.fabric.microsoft.com/9b421931-47b1-4094-a925-3a7b2c452773/Files/bronze/2020.csv?version=1705888013498?flength=286129 | false | 2024-01-22 | 2024-01-22 |
| SO45413 | 1 | 2020-01-11 | Kristi Perez | kristi39@adventure-works.com | Road-150 Red, 48 | 1 | 3578.27001953125 | 286.2615966796875 | abfss://ab3fb9ba-2fa2-4157-8037-21c99df09572@onelake.dfs.fabric.microsoft.com/9b421931-47b1-4094-a925-3a7b2c452773/Files/bronze/2020.csv?version=1705888013498?flength=286129 | false | 2024-01-22 | 2024-01-22 |
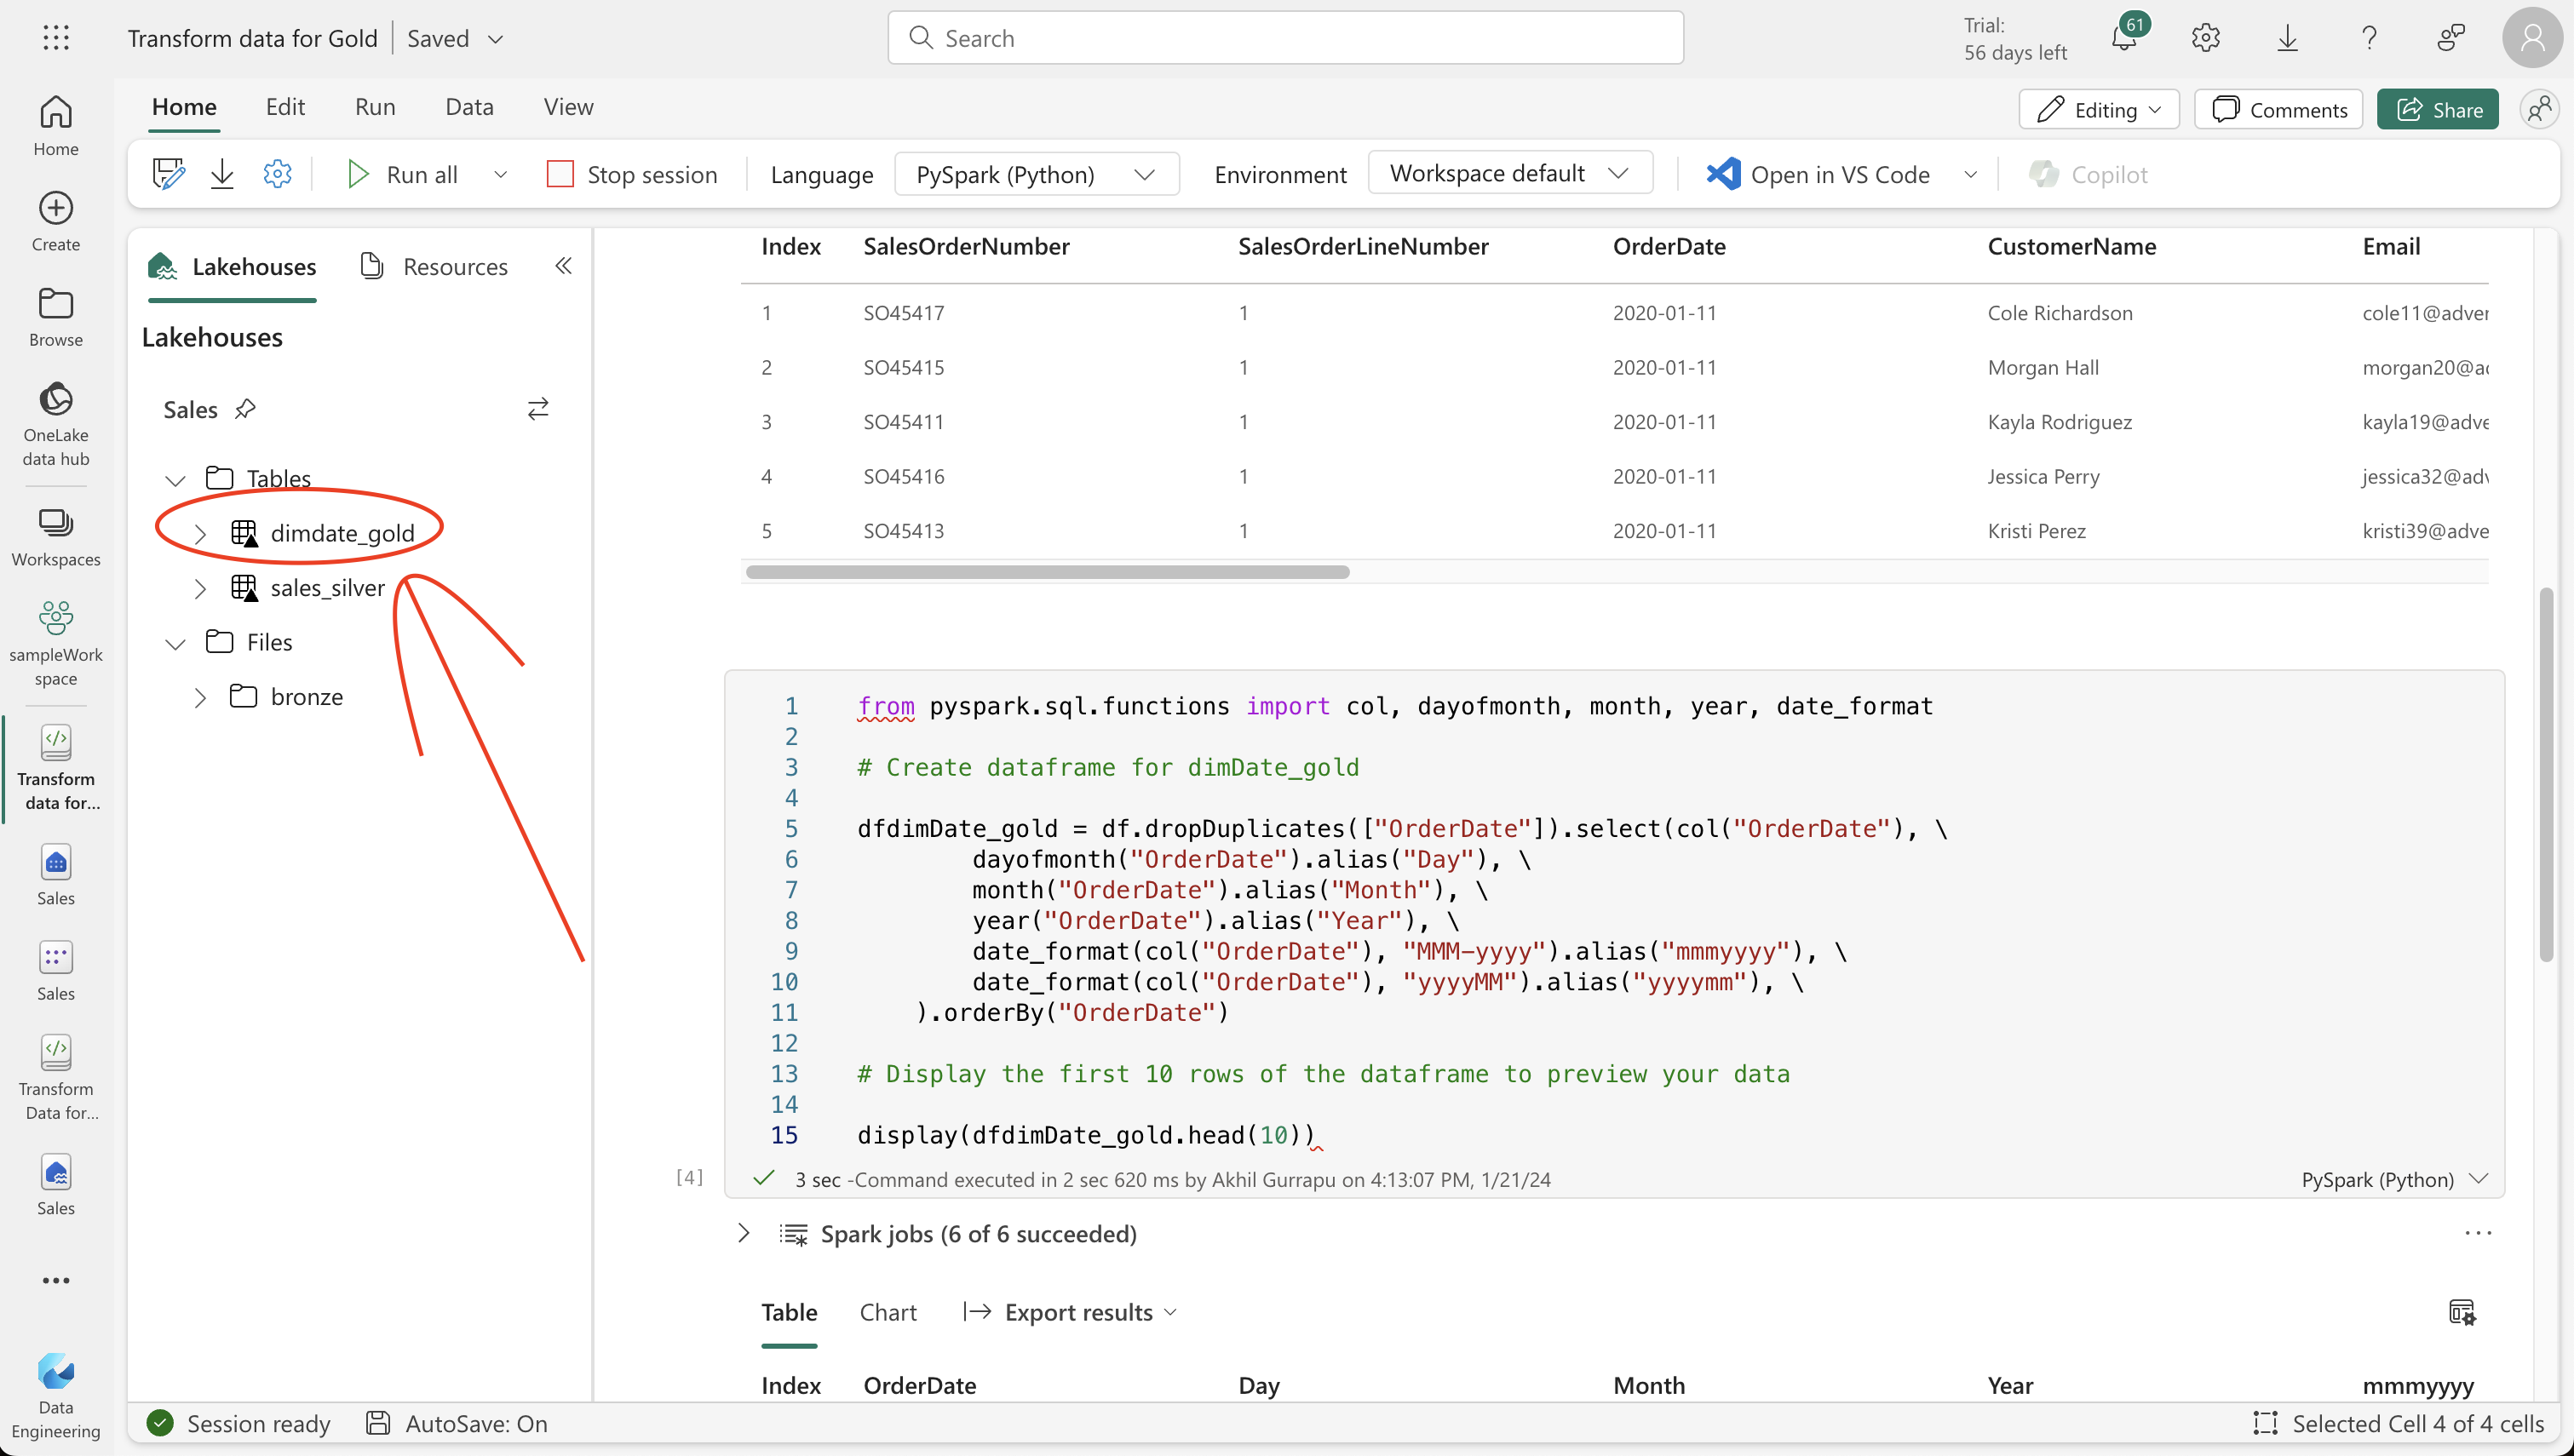
 from pyspark.sql.functions import col, dayofmonth, month, year, date_format

 # Create dataframe for dimDate_gold

 dfdimDate_gold = df.dropDuplicates(["OrderDate"]).select(col("OrderDate"), \
         dayofmonth("OrderDate").alias("Day"), \
         month("OrderDate").alias("Month"), \
         year("OrderDate").alias("Year"), \
         date_format(col("OrderDate"), "MMM-yyyy").alias("mmmyyyy"), \
         date_format(col("OrderDate"), "yyyyMM").alias("yyyymm"), \
     ).orderBy("OrderDate")

 # Display the first 10 rows of the dataframe to preview your data

 display(dfdimDate_gold.head(5))
StatementMeta(, b3a20ceb-d8f5-406c-9345-c95735936830, 7, Finished, Available)
| OrderDate | Day | Month | Year | mmmyyyy | yyyymm |
|------------|-----|-------|------|---------|--------|
| 2019-07-01 | 1 | 7 | 2019 | Jul-2019| 201907 |
| 2019-07-02 | 2 | 7 | 2019 | Jul-2019| 201907 |
| 2019-07-03 | 3 | 7 | 2019 | Jul-2019| 201907 |
| 2019-07-04 | 4 | 7 | 2019 | Jul-2019| 201907 |
| 2019-07-05 | 5 | 7 | 2019 | Jul-2019| 201907 |
 from delta.tables import *

 deltaTable = DeltaTable.forPath(spark, 'Tables/dimdate_gold')

 dfUpdates = dfdimDate_gold

 deltaTable.alias('silver') \
   .merge(
     dfUpdates.alias('updates'),
     'silver.OrderDate = updates.OrderDate'
   ) \
    .whenMatchedUpdate(set =
     {

     }
   ) \
  .whenNotMatchedInsert(values =
     {
       "OrderDate": "updates.OrderDate",
       "Day": "updates.Day",
       "Month": "updates.Month",
       "Year": "updates.Year",
       "mmmyyyy": "updates.mmmyyyy",
       "yyyymm": "yyyymm"
     }
   ) \
   .execute()
StatementMeta(, b3a20ceb-d8f5-406c-9345-c95735936830, 8, Finished, Available)
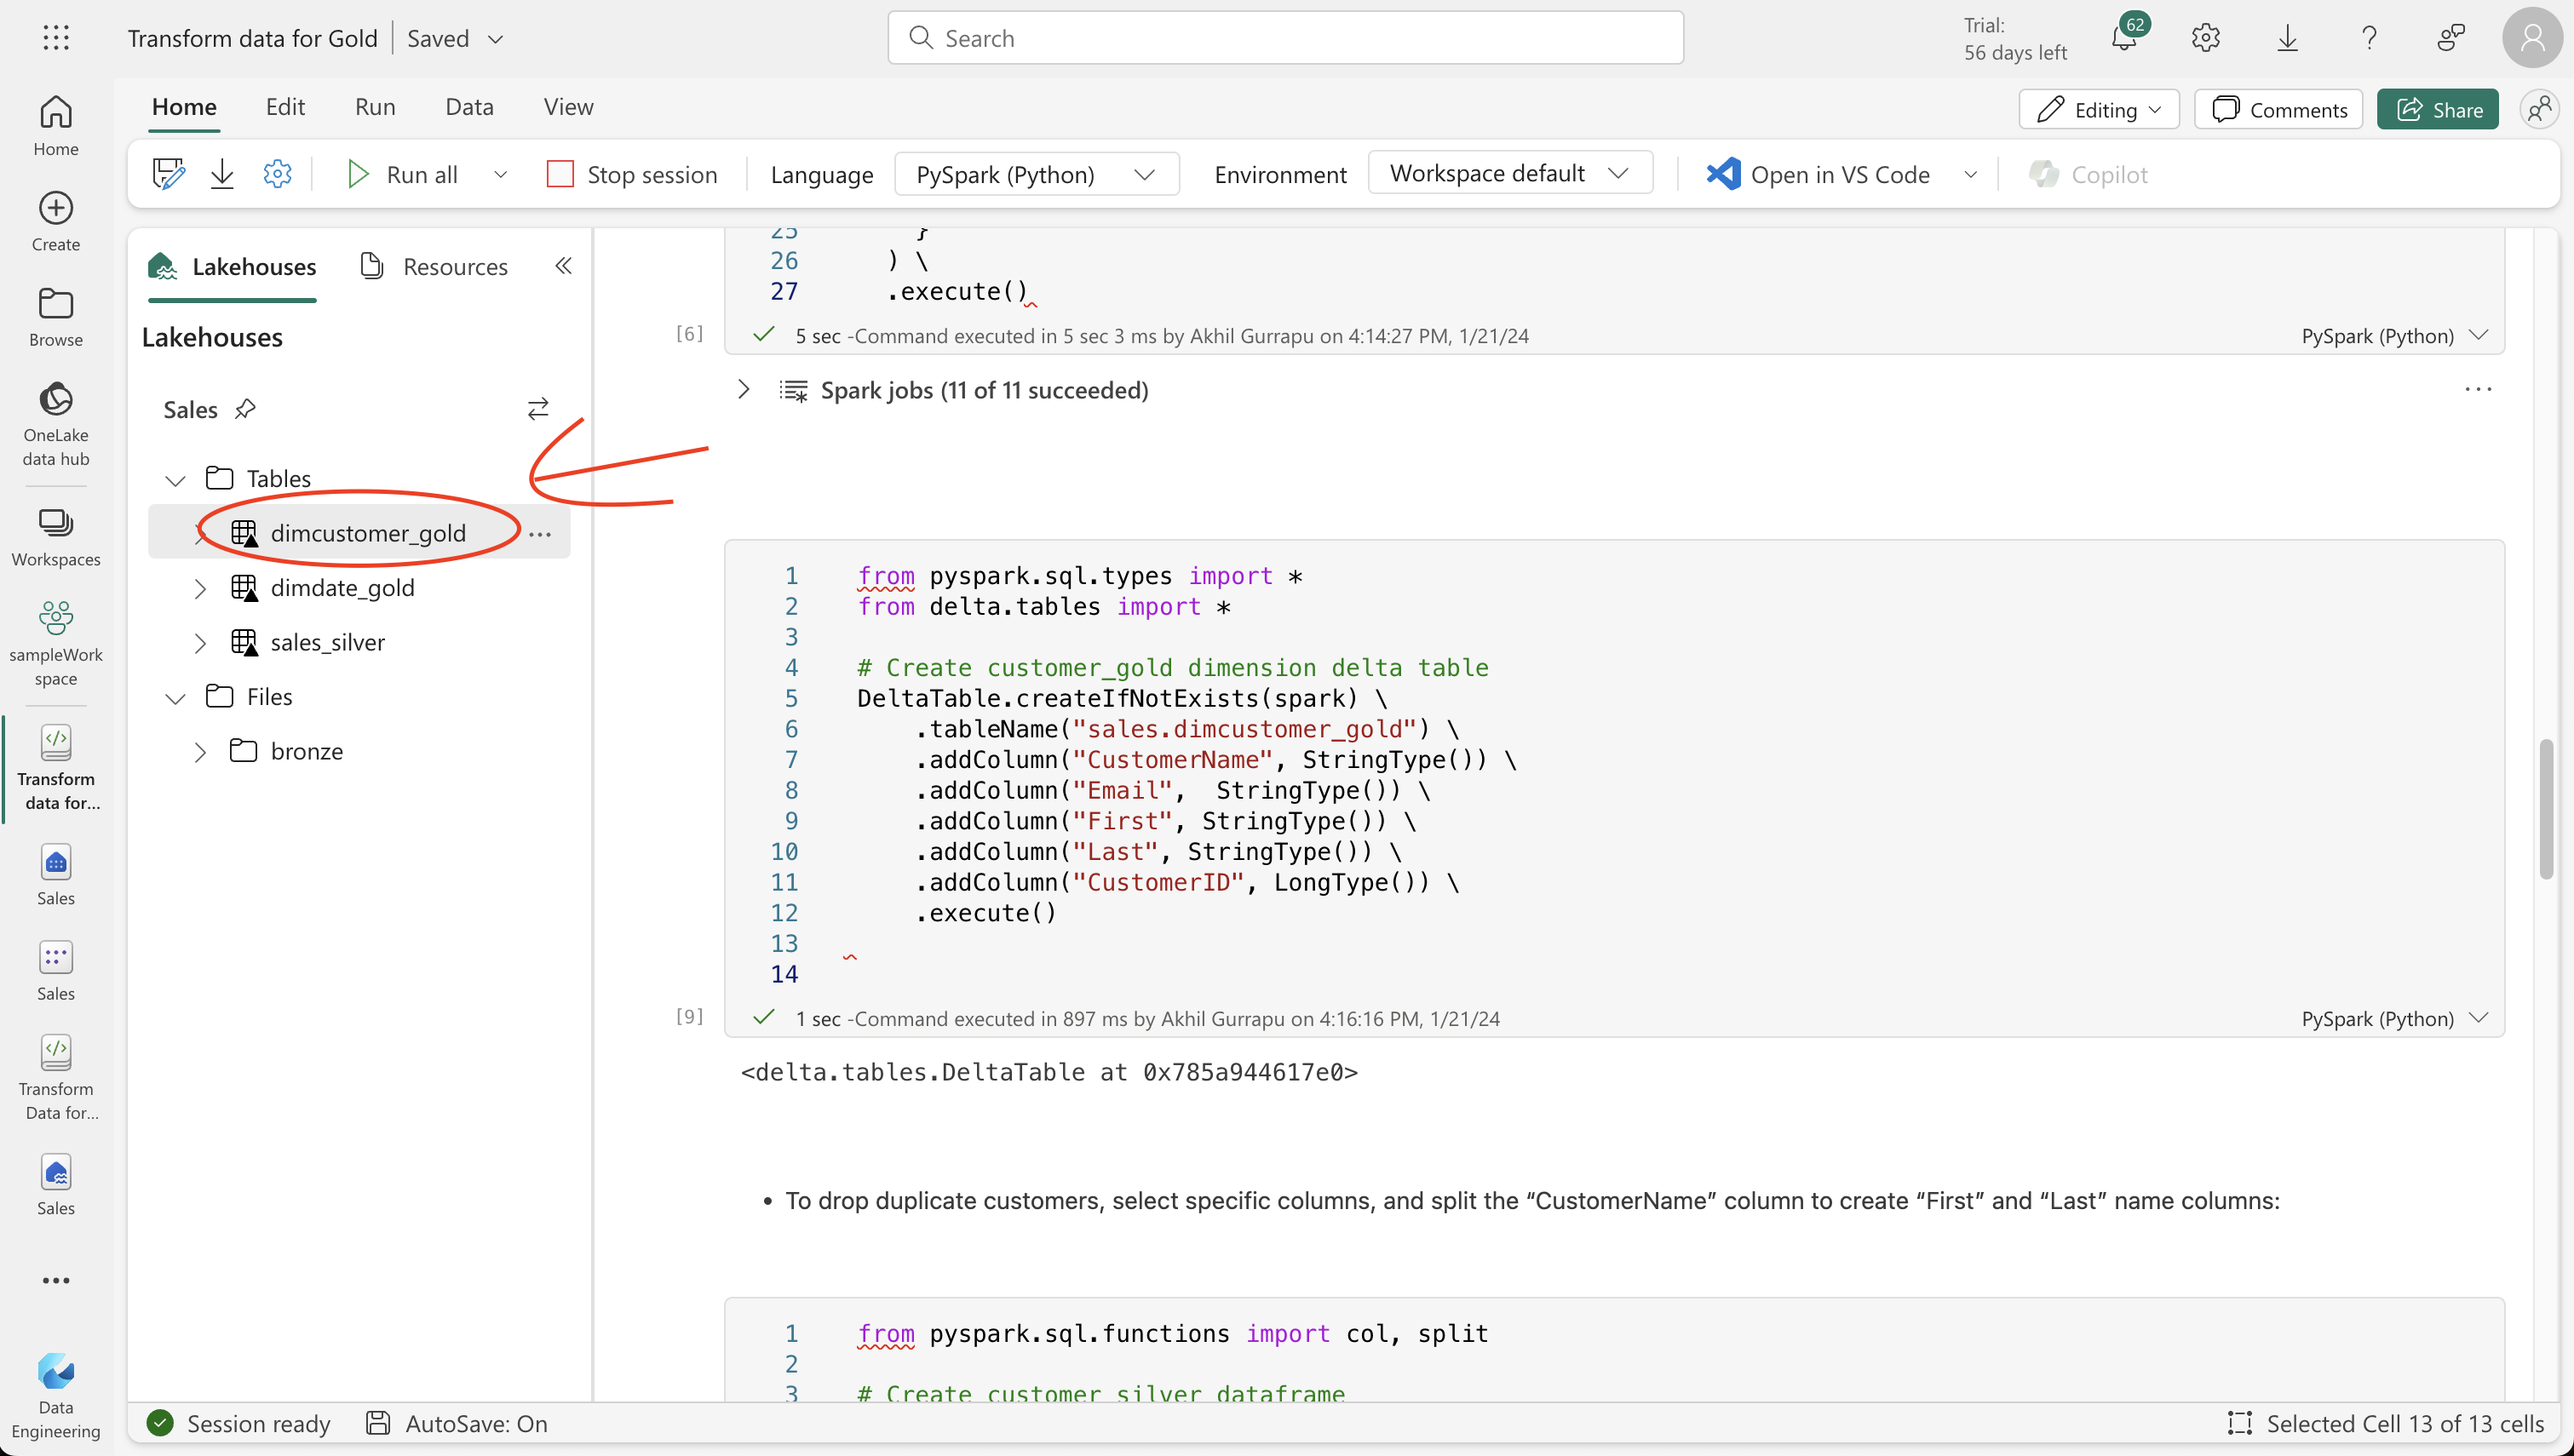
 from pyspark.sql.types import *
 from delta.tables import *

 # Create customer_gold dimension delta table
 DeltaTable.createIfNotExists(spark) \
     .tableName("sales.dimcustomer_gold") \
     .addColumn("CustomerName", StringType()) \
     .addColumn("Email",  StringType()) \
     .addColumn("First", StringType()) \
     .addColumn("Last", StringType()) \
     .addColumn("CustomerID", LongType()) \
     .execute()
StatementMeta(, b3a20ceb-d8f5-406c-9345-c95735936830, 11, Finished, Available)
<delta.tables.DeltaTable at 0x785a944617e0>
- To drop duplicate customers, select specific columns, and split the “CustomerName” column to create “First” and “Last” name columns:
 from pyspark.sql.functions import col, split

 # Create customer_silver dataframe

 dfdimCustomer_silver = df.dropDuplicates(["CustomerName","Email"]).select(col("CustomerName"),col("Email")) \
     .withColumn("First",split(col("CustomerName"), " ").getItem(0)) \
     .withColumn("Last",split(col("CustomerName"), " ").getItem(1))

 # Display the first 10 rows of the dataframe to preview your data

 display(dfdimCustomer_silver.head(5))
StatementMeta(, b3a20ceb-d8f5-406c-9345-c95735936830, 13, Finished, Available)
| CustomerName | Email | First | Last |
|---------------------|----------------------------|----------|----------|
| Caitlin Brooks | caitlin1@adventure-works.com | Caitlin | Brooks |
| Connor Ross | connor0@adventure-works.com | Connor | Ross |
| Melissa Perry | melissa2@adventure-works.com | Melissa | Perry |
| Jasmine West | jasmine37@adventure-works.com| Jasmine | West |
| Jonathon Gutierrez | jonathon8@adventure-works.com| Jonathon | Gutierrez|
- Here we have created a new DataFrame dfdimCustomer_silver by performing various transformations such as dropping duplicates, selecting specific columns, and splitting the “CustomerName” column to create “First” and “Last” name columns. The result is a DataFrame with cleaned and structured customer data, including separate “First” and “Last” name columns extracted from the “CustomerName” column.
 from pyspark.sql.functions import monotonically_increasing_id, col, when, coalesce, max, lit

 dfdimCustomer_temp = spark.read.table("Sales.dimCustomer_gold")

 MAXCustomerID = dfdimCustomer_temp.select(coalesce(max(col("CustomerID")),lit(0)).alias("MAXCustomerID")).first()[0]

 dfdimCustomer_gold = dfdimCustomer_silver.join(dfdimCustomer_temp,(dfdimCustomer_silver.CustomerName == dfdimCustomer_temp.CustomerName) & (dfdimCustomer_silver.Email == dfdimCustomer_temp.Email), "left_anti")

 dfdimCustomer_gold = dfdimCustomer_gold.withColumn("CustomerID",monotonically_increasing_id() + MAXCustomerID + 1)

 # Display the first 10 rows of the dataframe to preview your data

 display(dfdimCustomer_gold.head(5))
StatementMeta(, b3a20ceb-d8f5-406c-9345-c95735936830, 15, Finished, Available)
| CustomerName | Email | First | Last | CustomerID |
|---------------------|----------------------------|----------|----------|------------|
| Caitlin Brooks | caitlin1@adventure-works.com | Caitlin | Brooks | 1 |
| Connor Ross | connor0@adventure-works.com | Connor | Ross | 2 |
| Melissa Perry | melissa2@adventure-works.com | Melissa | Perry | 3 |
| Jasmine West | jasmine37@adventure-works.com| Jasmine | West | 4 |
| Jonathon Gutierrez | jonathon8@adventure-works.com| Jonathon | Gutierrez| 5 |
- Here you’re cleaning and transforming customer data (dfdimCustomer_silver) by performing a left anti join to exclude duplicates that already exist in the dimCustomer_gold table, and then generating unique CustomerID values using the monotonically_increasing_id() function.
from delta.tables import *

deltaTable = DeltaTable.forPath(spark, 'Tables/dimcustomer_gold')

dfUpdates = dfdimCustomer_gold

deltaTable.alias('silver') \
  .merge(
    dfUpdates.alias('updates'),
    'silver.CustomerName = updates.CustomerName AND silver.Email = updates.Email'
  ) \
   .whenMatchedUpdate(set =
    {

    }
  ) \
 .whenNotMatchedInsert(values =
    {
      "CustomerName": "updates.CustomerName",
      "Email": "updates.Email",
      "First": "updates.First",
      "Last": "updates.Last",
      "CustomerID": "updates.CustomerID"
    }
  ) \
  .execute()
StatementMeta(, b3a20ceb-d8f5-406c-9345-c95735936830, 16, Finished, Available)
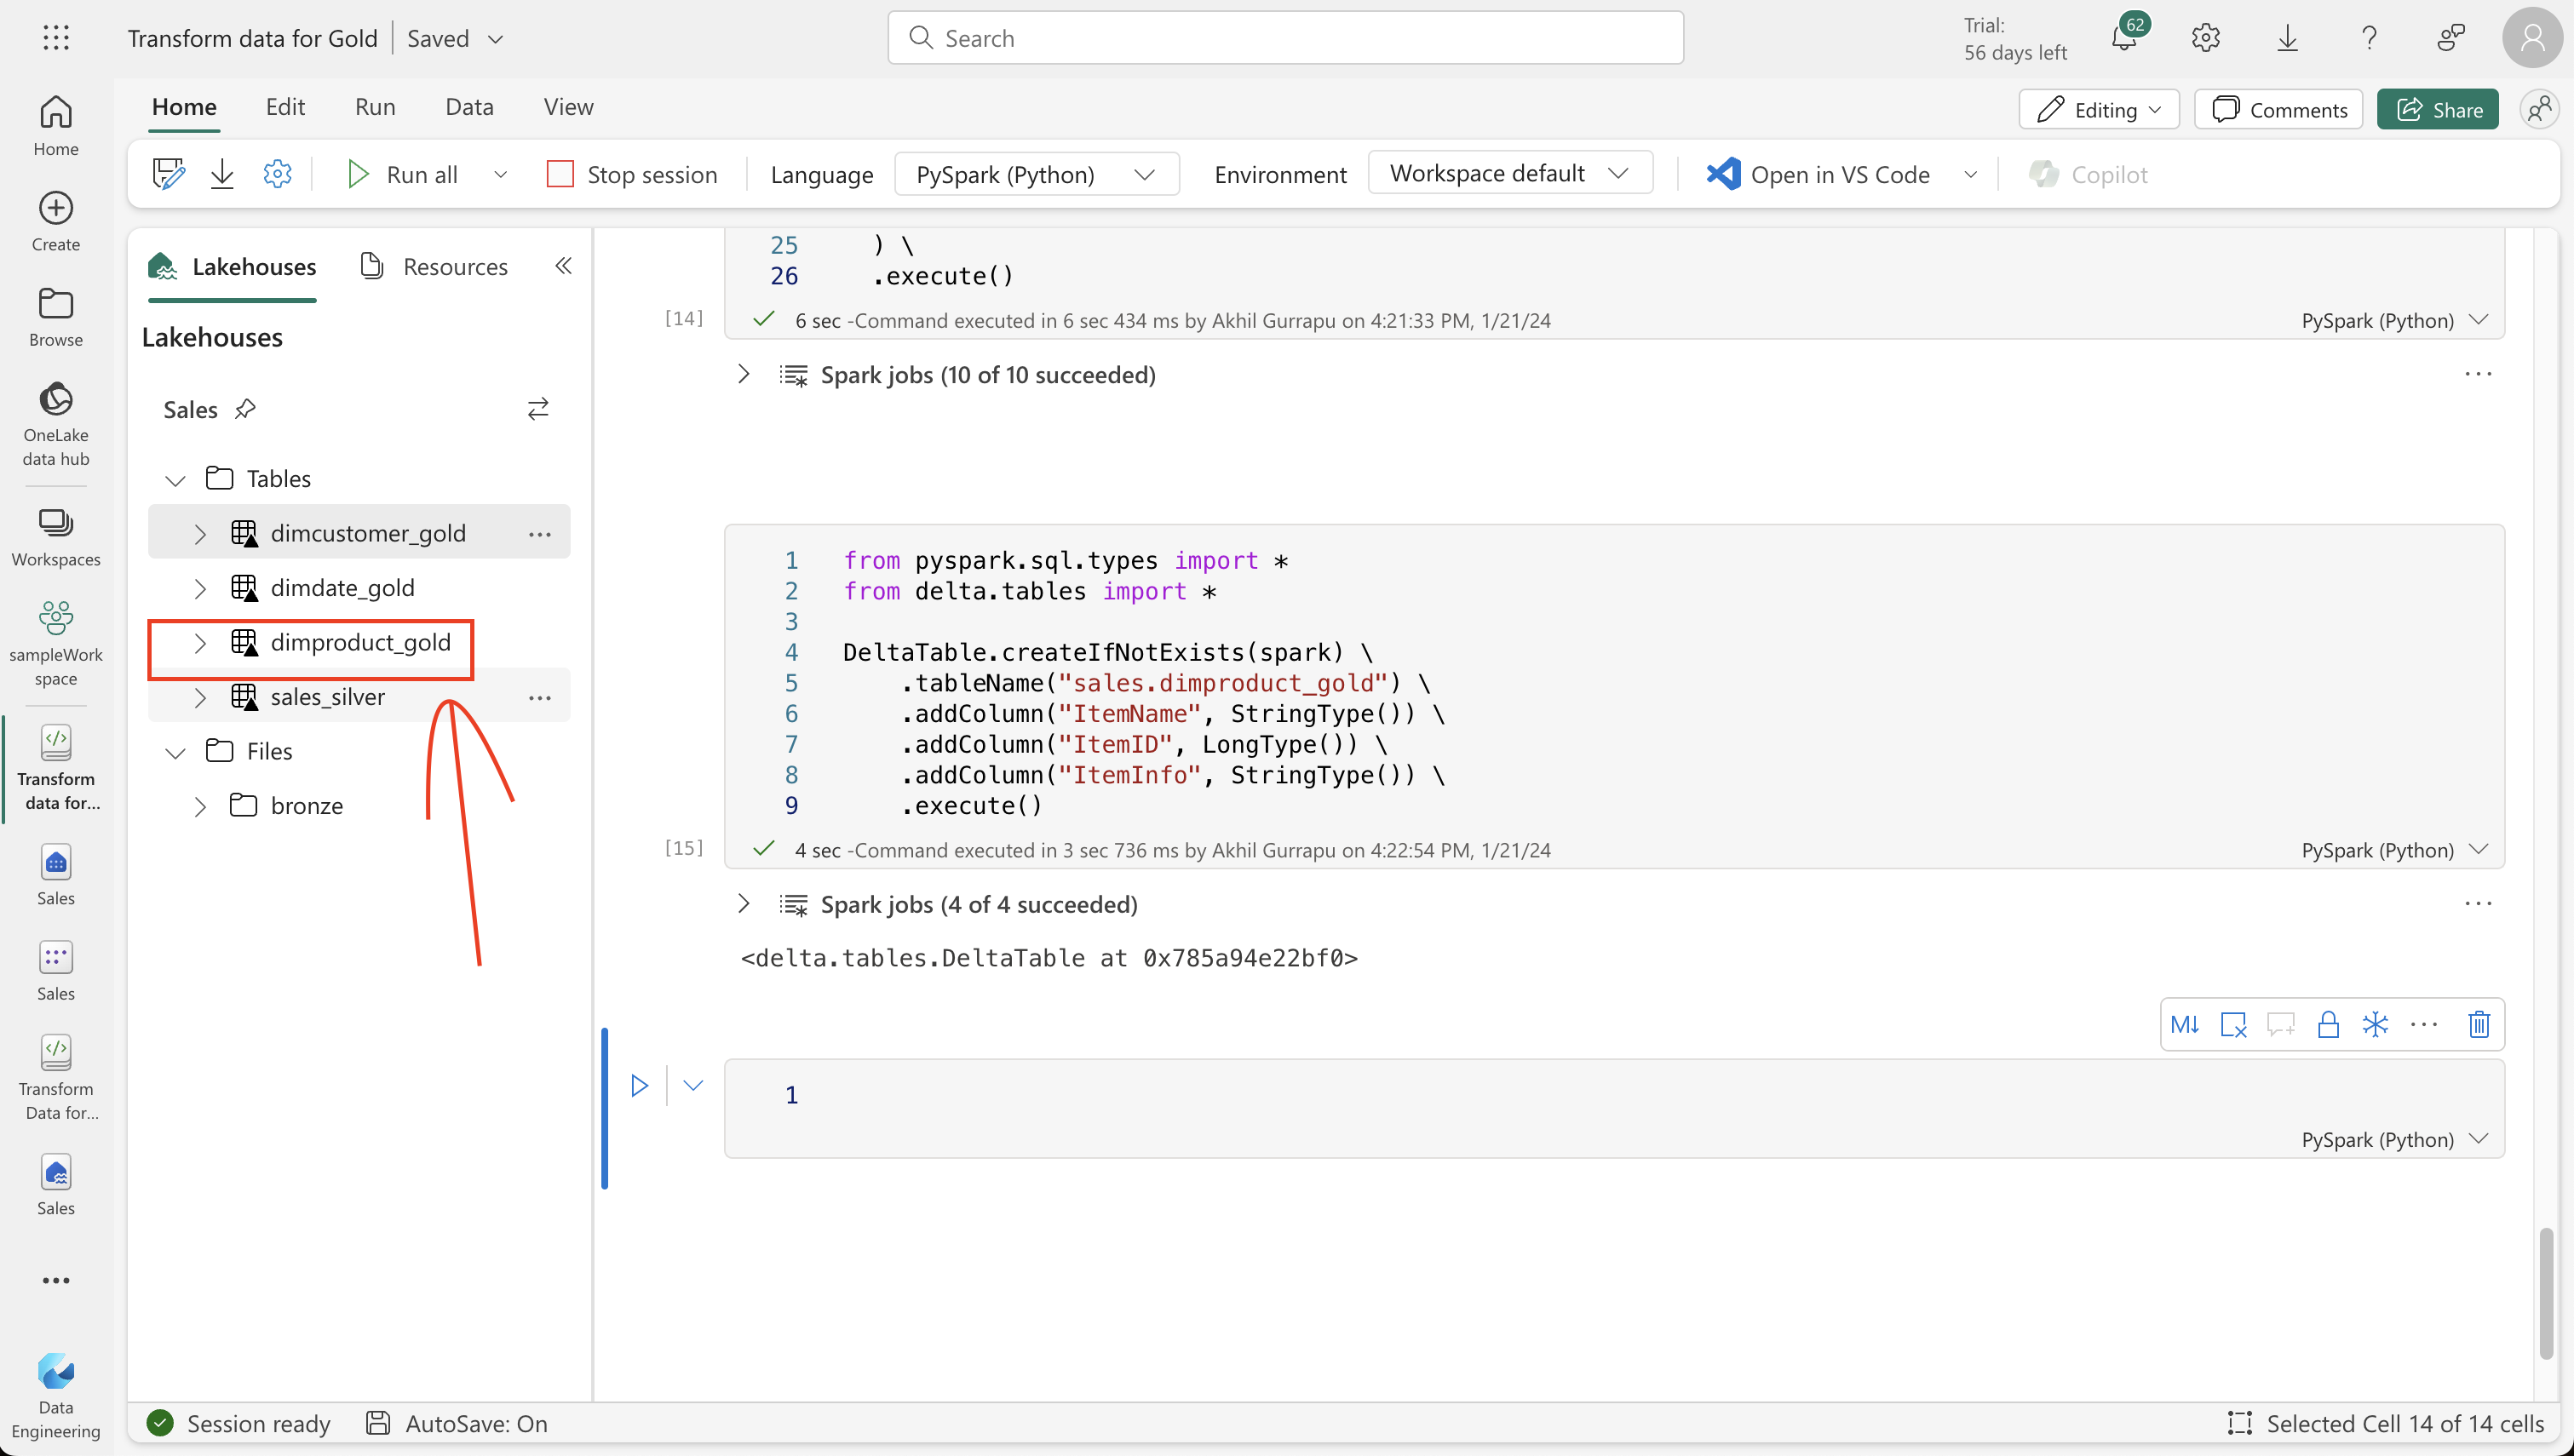
from pyspark.sql.types import *
from delta.tables import *

DeltaTable.createIfNotExists(spark) \
    .tableName("sales.dimproduct_gold") \
    .addColumn("ItemName", StringType()) \
    .addColumn("ItemID", LongType()) \
    .addColumn("ItemInfo", StringType()) \
    .execute()
StatementMeta(, b3a20ceb-d8f5-406c-9345-c95735936830, 17, Finished, Available)
<delta.tables.DeltaTable at 0x785a94e22bf0>
from pyspark.sql.functions import col, split, lit

# Create product_silver dataframe

dfdimProduct_silver = df.dropDuplicates(["Item"]).select(col("Item")) \
    .withColumn("ItemName",split(col("Item"), ", ").getItem(0)) \
    .withColumn("ItemInfo",when((split(col("Item"), ", ").getItem(1).isNull() | (split(col("Item"), ", ").getItem(1)=="")),lit("")).otherwise(split(col("Item"), ", ").getItem(1)))

# Display the first 10 rows of the dataframe to preview your data

display(dfdimProduct_silver.head(5))
StatementMeta(, b3a20ceb-d8f5-406c-9345-c95735936830, 19, Finished, Available)
| Item | ItemName | ItemInfo |
|---------------------------|---------------------------|----------|
| Mountain-200 Black, 42 | Mountain-200 Black | 42 |
| Touring-1000 Yellow, 46 | Touring-1000 Yellow | 46 |
| Touring-1000 Blue, 54 | Touring-1000 Blue | 54 |
| Short-Sleeve Classic Jersey, S | Short-Sleeve Classic Jersey | S |
| Women's Mountain Shorts, S | Women's Mountain Shorts | S |
from pyspark.sql.functions import monotonically_increasing_id, col, lit, max, coalesce

#dfdimProduct_temp = dfdimProduct_silver
dfdimProduct_temp = spark.read.table("Sales.dimProduct_gold")

MAXProductID = dfdimProduct_temp.select(coalesce(max(col("ItemID")),lit(0)).alias("MAXItemID")).first()[0]

dfdimProduct_gold = dfdimProduct_silver.join(dfdimProduct_temp,(dfdimProduct_silver.ItemName == dfdimProduct_temp.ItemName) & (dfdimProduct_silver.ItemInfo == dfdimProduct_temp.ItemInfo), "left_anti")

dfdimProduct_gold = dfdimProduct_gold.withColumn("ItemID",monotonically_increasing_id() + MAXProductID + 1)

# Display the first 10 rows of the dataframe to preview your data

display(dfdimProduct_gold.head(5))
StatementMeta(, b3a20ceb-d8f5-406c-9345-c95735936830, 20, Finished, Available)
| Item | ItemName | ItemInfo | ItemID |
|---------------------------|---------------------------|----------|--------|
| Mountain-200 Black, 42 | Mountain-200 Black | 42 | 1 |
| Touring-1000 Yellow, 46 | Touring-1000 Yellow | 46 | 2 |
| Touring-1000 Blue, 54 | Touring-1000 Blue | 54 | 3 |
| Short-Sleeve Classic Jersey, S | Short-Sleeve Classic Jersey | S | 4 |
| Women's Mountain Shorts, S | Women's Mountain Shorts | S | 5 |
- This calculates the next available product ID based on the current data in the table, assigns these new IDs to the products, and then displays the updated product information.
from delta.tables import *

deltaTable = DeltaTable.forPath(spark, 'Tables/dimproduct_gold')

dfUpdates = dfdimProduct_gold

deltaTable.alias('silver') \
  .merge(
        dfUpdates.alias('updates'),
        'silver.ItemName = updates.ItemName AND silver.ItemInfo = updates.ItemInfo'
        ) \
        .whenMatchedUpdate(set =
        {

        }
        ) \
        .whenNotMatchedInsert(values =
         {
          "ItemName": "updates.ItemName",
          "ItemInfo": "updates.ItemInfo",
          "ItemID": "updates.ItemID"
          }
          ) \
          .execute()
StatementMeta(, b3a20ceb-d8f5-406c-9345-c95735936830, 21, Finished, Available)
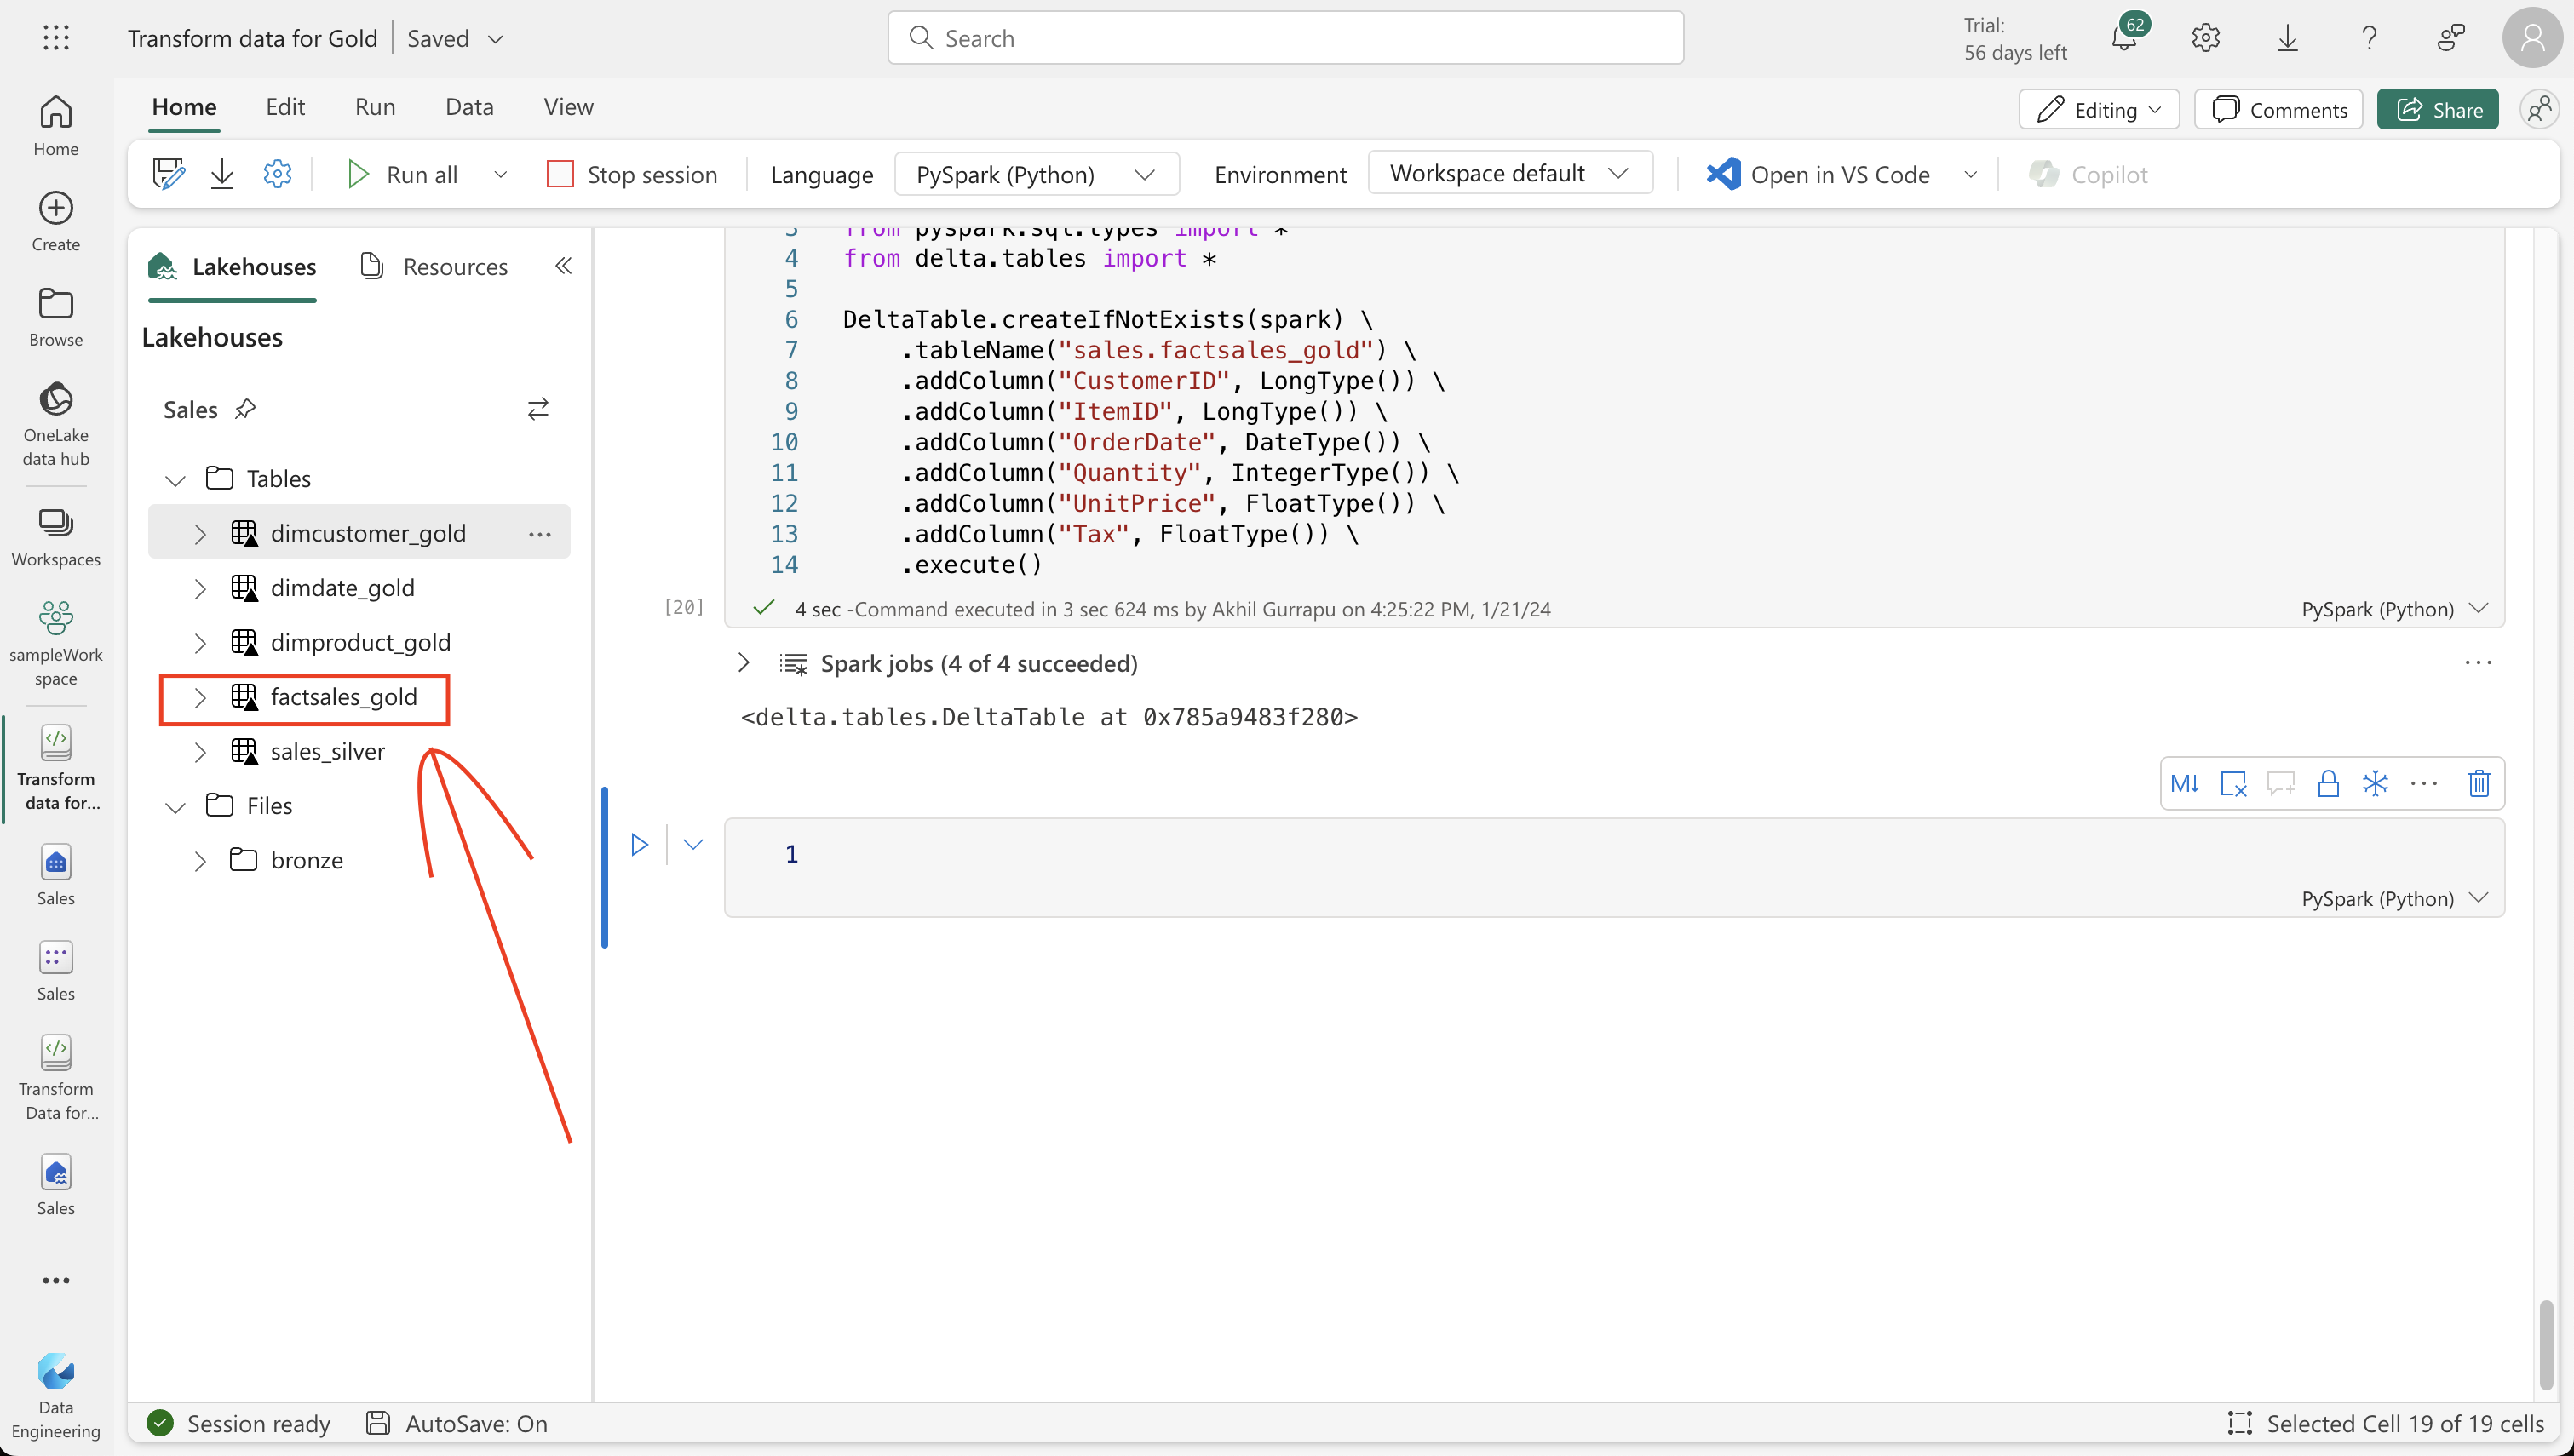
#Creating Facts Table:

from pyspark.sql.types import *
from delta.tables import *

DeltaTable.createIfNotExists(spark) \
    .tableName("sales.factsales_gold") \
    .addColumn("CustomerID", LongType()) \
    .addColumn("ItemID", LongType()) \
    .addColumn("OrderDate", DateType()) \
    .addColumn("Quantity", IntegerType()) \
    .addColumn("UnitPrice", FloatType()) \
    .addColumn("Tax", FloatType()) \
    .execute()
StatementMeta(, b3a20ceb-d8f5-406c-9345-c95735936830, 22, Finished, Available)
<delta.tables.DeltaTable at 0x785a9483f280>
from pyspark.sql.functions import col

dfdimCustomer_temp = spark.read.table("Sales.dimCustomer_gold")
dfdimProduct_temp = spark.read.table("Sales.dimProduct_gold")

df = df.withColumn("ItemName",split(col("Item"), ", ").getItem(0)) \
    .withColumn("ItemInfo",when((split(col("Item"), ", ").getItem(1).isNull() | (split(col("Item"), ", ").getItem(1)=="")),lit("")).otherwise(split(col("Item"), ", ").getItem(1))) \


# Create Sales_gold dataframe

dffactSales_gold = df.alias("df1").join(dfdimCustomer_temp.alias("df2"),(df.CustomerName == dfdimCustomer_temp.CustomerName) & (df.Email == dfdimCustomer_temp.Email), "left") \
        .join(dfdimProduct_temp.alias("df3"),(df.ItemName == dfdimProduct_temp.ItemName) & (df.ItemInfo == dfdimProduct_temp.ItemInfo), "left") \
    .select(col("df2.CustomerID") \
        , col("df3.ItemID") \
        , col("df1.OrderDate") \
        , col("df1.Quantity") \
        , col("df1.UnitPrice") \
        , col("df1.Tax") \
    ).orderBy(col("df1.OrderDate"), col("df2.CustomerID"), col("df3.ItemID"))

# Display the first 10 rows of the dataframe to preview your data

display(dffactSales_gold.head(5))
StatementMeta(, b3a20ceb-d8f5-406c-9345-c95735936830, 23, Finished, Available)
| CustomerID | ItemID | OrderDate | Quantity | UnitPrice | Tax |
|————|——–|————|———-|——————–|——————–| | 1689 | 15 | 2019-07-01 | 1 | 3399.989990234375 | 271.99920654296875 | | 2629 | 65 | 2019-07-01 | 1 | 3578.27001953125 | 286.2615966796875 | | 5001 | 55 | 2019-07-01 | 1 | 3578.27001953125 | 286.2615966796875 | | 6098 | 25 | 2019-07-01 | 1 | 3399.989990234375 | 271.99920654296875 | | 6499 | 76 | 2019-07-01 | 1 | 699.0982055664062 | 55.92789840698242 |
from delta.tables import *

deltaTable = DeltaTable.forPath(spark, 'Tables/factsales_gold')

dfUpdates = dffactSales_gold

deltaTable.alias('silver') \
  .merge(
    dfUpdates.alias('updates'),
    'silver.OrderDate = updates.OrderDate AND silver.CustomerID = updates.CustomerID AND silver.ItemID = updates.ItemID'
  ) \
   .whenMatchedUpdate(set =
    {

    }
  ) \
 .whenNotMatchedInsert(values =
    {
      "CustomerID": "updates.CustomerID",
      "ItemID": "updates.ItemID",
      "OrderDate": "updates.OrderDate",
      "Quantity": "updates.Quantity",
      "UnitPrice": "updates.UnitPrice",
      "Tax": "updates.Tax"
    }
  ) \
  .execute()
StatementMeta(, b3a20ceb-d8f5-406c-9345-c95735936830, 24, Finished, Available)
-
Here we’re using Delta Lake’s merge operation to synchronize and update the factsales_gold table with new sales data (dffactSales_gold). The operation compares the order date, customer ID, and item ID between the existing data (silver table) and the new data (updates DataFrame), updating matching records and inserting new records as needed.
-
We now have a curated, modeled gold layer that can be used for reporting and analysis.
6. Finalizing with the Fact Table
Create a fact table for comprehensive sales data, combining customer and product information. Run a merge operation using Delta Lake’s functionality to synchronize the latest sales data.
7. Creating a Dataset for Analysis
In your workspace, use the gold layer to create a dataset for reporting and analysis. Include all gold tables in your Power BI dataset and set up relationships and measures. This dataset can then be used for creating reports and dashboards.