Data Warehouses in Microsoft Fabric
Explore the power of Microsoft Fabric's data warehouse, designed for seamless collaboration among data professionals. Learn data ingestion, storage, querying, modeling, and visualization essentials. Create your own Fabric data warehouse and harness insights for effective business intelligence.


Data Warehouses in Microsoft Fabric
In today’s data-driven business landscape, relational data warehouses are pivotal in driving enterprise business intelligence (BI) strategies. While each data warehouse has its nuances, a prevalent design pattern revolves around a denormalized, multidimensional schema. This structure is fundamental in most modern BI solutions.
Microsoft Fabric is at the forefront of revolutionizing traditional data warehouse concepts. Its data warehouse not only centralizes data from various departments, systems, and databases but also presents it in a unified, analyzable format. This integration is crucial for effective analysis and reporting.
What sets Fabric’s data warehouse apart is its foundation on the Lakehouse and its storage in Delta format, making it SQL-query-friendly. This approach enables a range of SQL operations like insert, update, and delete, providing flexibility and power in data manipulation.
The beauty of Fabric’s system lies in its inclusivity – it’s engineered for the entire data team. Data engineers, analysts, and data scientists can collaboratively harness this warehouse, tailoring it to meet their unique requirements. This synergy ensures an optimized, efficient, and effective data handling process.
Through this article, you will embark on a journey to understand the intricacies of Fabric’s data warehouse. You’ll learn how to:
- Create a Data Warehouse in Fabric: Understand the steps to initialize and set up your data warehouse, making it ready for data integration.
- Load Data Effectively: Discover the methods to import data from different sources into your Fabric data warehouse, ensuring accuracy and consistency.
- Querying with Precision: Learn the art of crafting SQL queries to extract meaningful insights from your data, taking advantage of Fabric’s full SQL semantics.
- Data Visualization: Explore techniques to transform your data into visual reports and dashboards, making the interpretation of complex data sets simpler and more intuitive.
- Describing Datasets: Gain knowledge on how to effectively describe your datasets, an essential skill for data documentation and understanding.
Data Warehouse Fundamentals
- Data Ingestion: Transferring data from source systems into the data warehouse.
- Data Storage: Keeping data in a format suitable for analytics.
- Data Processing: Preparing data for consumption by analytical tools.
- Data Analysis and Delivery: Analyzing data for insights and delivering these to the business.
Understanding Data Warehousing in Fabric
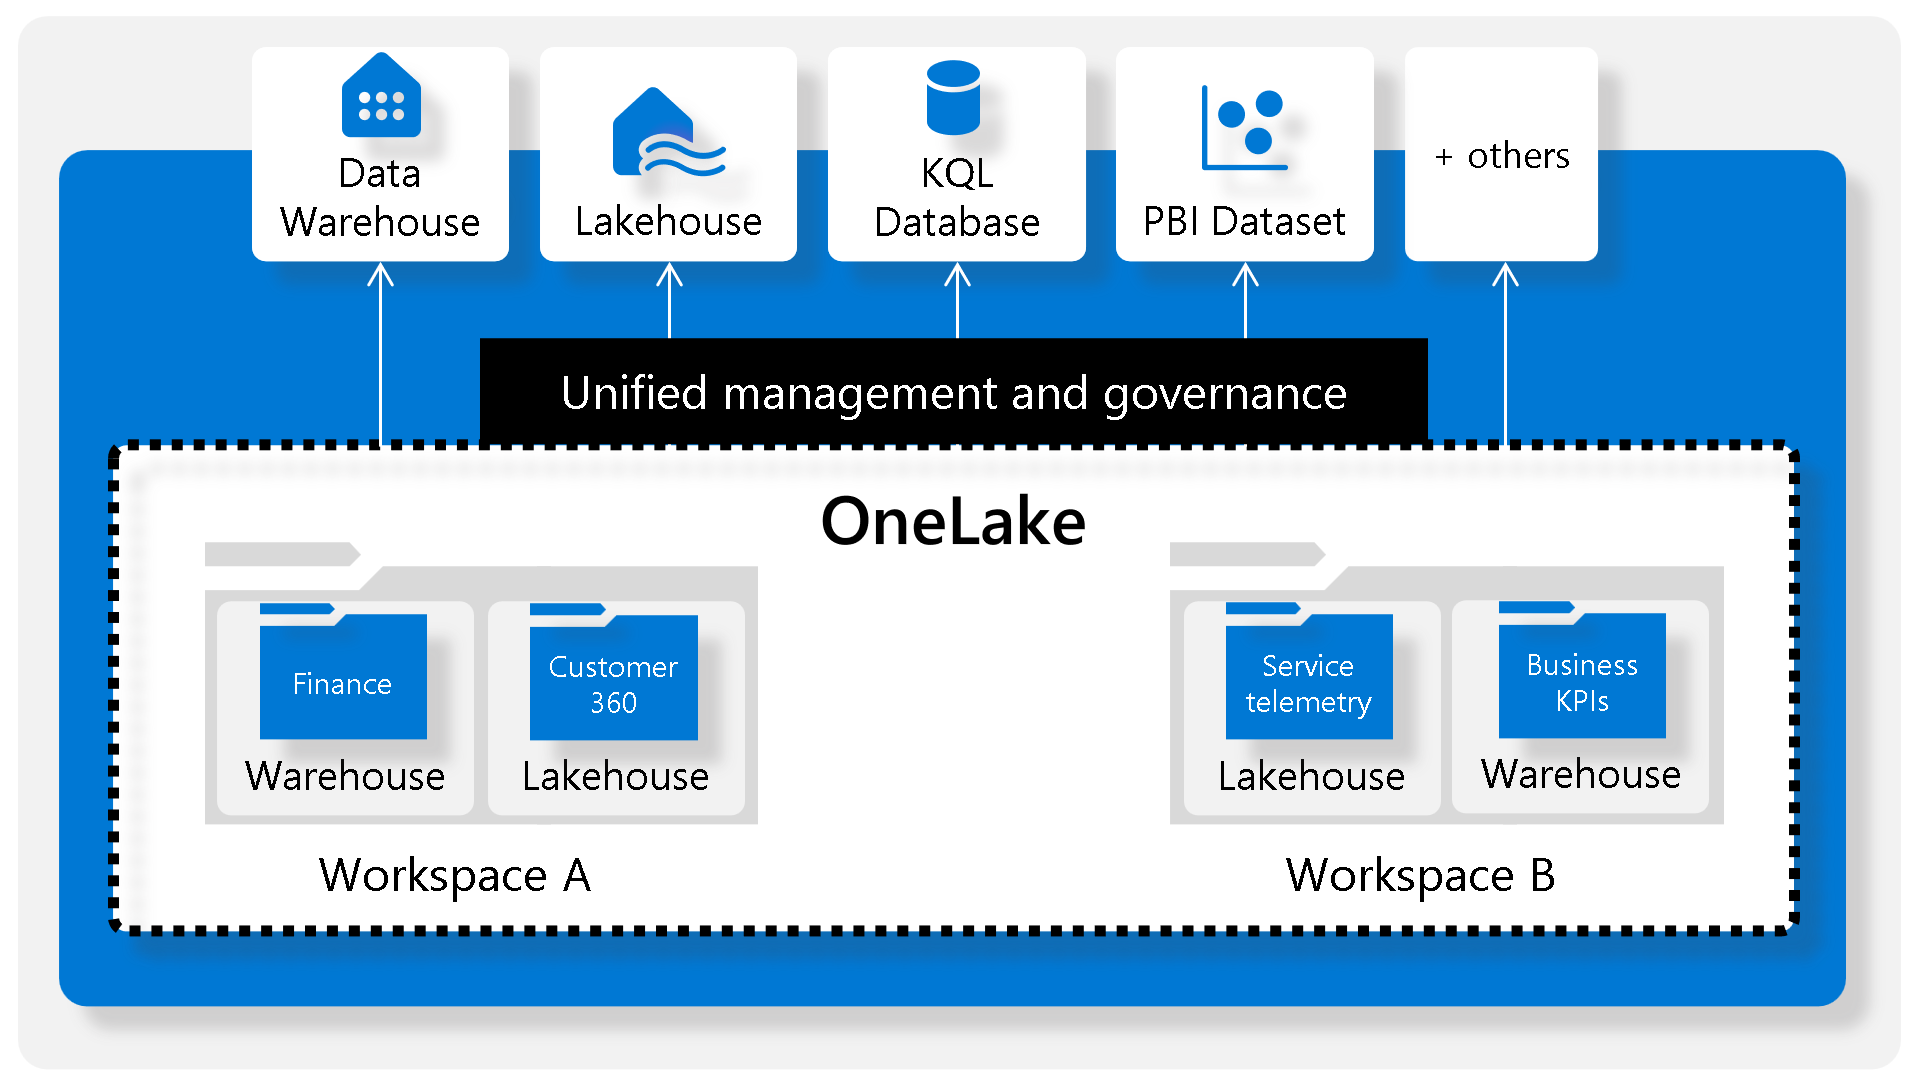
Fabric’s data ecosystem offers two powerful tools for data management: the Lakehouse and the Data Warehouse.
-
Fabric’s Lakehouse: This is essentially a collection of files, tables, and shortcuts that function like a database over a data lake. It’s well-suited for big data processing using the Spark and SQL engines and supports ACID transactions with Delta formatted tables. However, it’s not ideal for directly serving data to business users.
-
Fabric’s Data Warehouse: This feature bridges the gap, offering a traditional data warehouse experience. It allows for modeling data using tables and views, running T-SQL queries, and performing DML operations. It’s also compatible with reporting layers like Power BI, making it more suitable for business analytics.
Microsoft Fabric’s Role
- Unified Tool: Enables data engineers and analysts to perform all stages of data warehousing – ingestion, storage, transformation, visualization – through both low-code and traditional methods.
- Fabric’s Data Warehouse Features: Offers a relational data warehouse with full T-SQL capabilities, scalability, and high availability. It integrates with Lakehouse for data storage and querying.
- Collaborative Approach:
- Data Engineers and Analysts: Data engineers build a relational layer over Lakehouse data, and analysts use T-SQL and Power BI for data exploration.
Designing Data Warehouses in Fabric
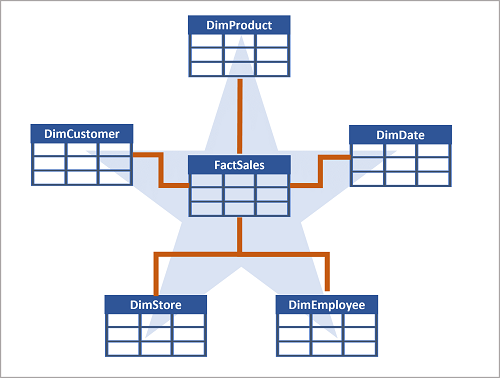
- Dimensional Modeling: Fabric’s tables are optimized for multidimensional modeling, featuring fact tables for numerical data and dimension tables for descriptive data.
- Fact Tables: Store primary data for analysis.
- Dimension Tables: Provide context for fact table data, containing both surrogate and alternate keys for unique identification and traceability.
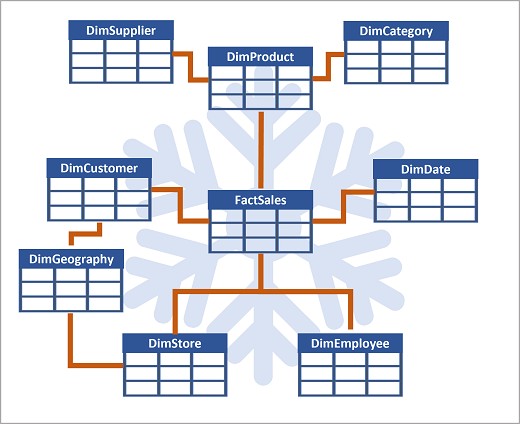
- Special Dimension Tables: a. Time Dimensions: For aggregating data over time. b. Slowly Changing Dimensions: Track changes over time to ensure data accuracy.
- Schema Designs:
Star Schema: A simple design with a central fact table directly linked to dimension tables. Suitable for simpler queries with fewer levels.
Snowflake Schema: A more complex design where some dimension tables are further normalized. Better for complex queries with multiple levels or shared information.
How to Create and Use a Data Warehouse in Fabric
-
Creating a Data Warehouse:
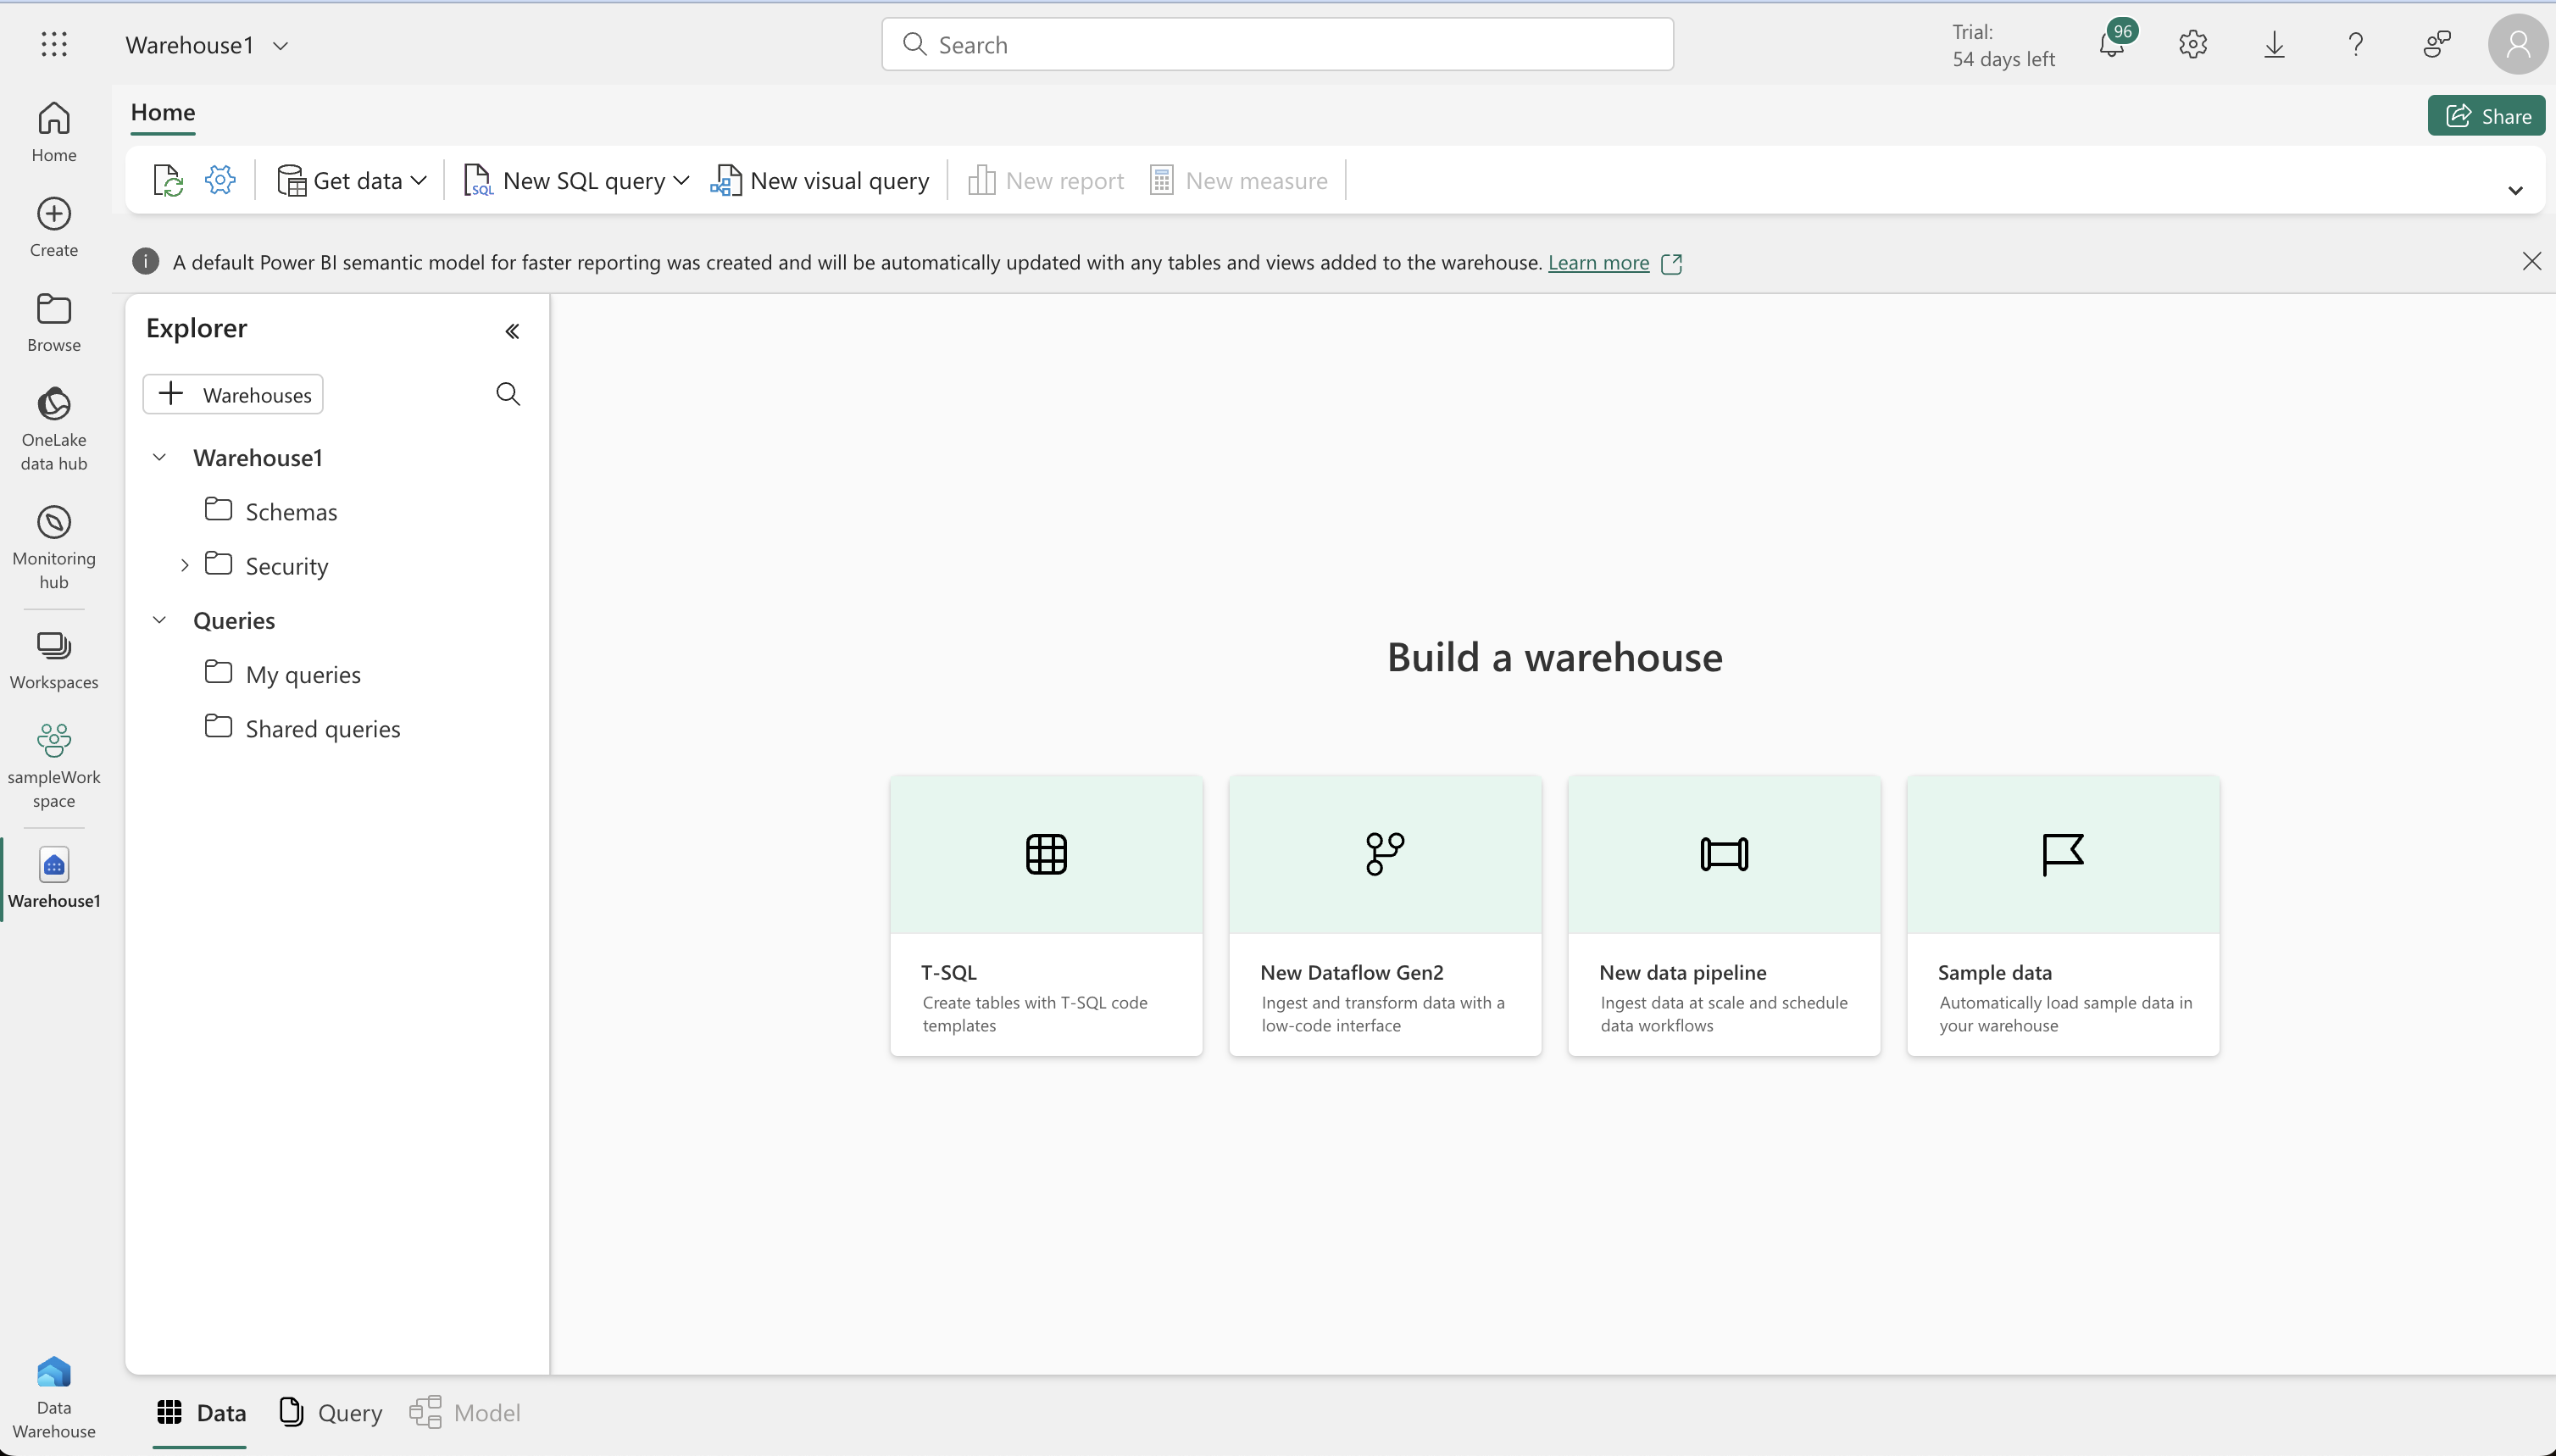
- You can create a data warehouse in Fabric via the create hub or within a workspace.
- Post-creation, tables can be created using T-SQL directly within Fabric’s interface.
-
Ingesting Data:
- Data can be ingested into your warehouse through various means such as Pipelines, Dataflows, cross-database querying, or the COPY INTO command.
- Example: Using COPY INTO syntax to load data from Azure Blob Storage into a warehouse table.
-
Table Management:
- Consider using staging tables for data loading. These temporary tables help in data cleansing, transformations, and validation before moving data to the main tables.
- The data loading process typically involves:
- Ingesting new data into a data lake with pre-load processing.
- Loading data from files into staging tables in the warehouse.
- Updating dimension tables and fact tables from staging tables, including surrogate key generation.
- Post-load optimization like updating indexes and statistics.
-
Cross-database Querying:
- Fabric allows querying data in the lakehouse directly from the data warehouse, without the need to duplicate data.
Querying Data in Microsoft Fabric Data Warehouse:
- SQL Query Editor: Offers an experience similar to SSMS or ADS, with features like intellisense and syntax highlighting. It’s used to author and run T-SQL queries.
- Visual Query Editor: No-code, drag-and-drop interface, similar to Power Query. It allows adding columns, filters, and transformations to queries.
Preparing Data for Analysis:
- Data Model: Defines relationships between tables, aggregation rules, and calculations for insights.
- Views: Switch between Data, Query, and Model views for different perspectives.
- Building Relationships: Create relationships between tables using a click-and-drag interface in the Model view.
- Creating Measures: Use DAX formula language to create calculated fields for analysis.
- Hiding Fields: Simplify report building by hiding unnecessary tables or columns.
Understanding and Using Datasets:
- Dataset Features: Automatically synced with the data warehouse; customizable for specific needs.
- Default Dataset: Inherits logic from the parent lakehouse or warehouse, and is automatically managed and optimized.
Visualizing Data:
- Utilize the “New report” button to create Power BI reports directly from the data warehouse.
For more: Querying in Microsoft Fabric Datawarehouse
Monitoring of Microsoft Fabric Data Warehouse
Data warehouses play a pivotal role in enterprise analysis and reporting. Monitoring these warehouses, especially when using Microsoft Fabric, is crucial for cost management, query performance optimization, and gaining valuable data insights.
1. Monitoring Capacity Metrics
To manage costs effectively, it’s important to monitor the capacity unit (CU) usage. The Microsoft Fabric Capacity Metrics app helps in observing capacity utilization trends in your data warehouse. It provides insights into CU consumption by data read and write activities, aiding in optimizing your capacity license according to your needs.
2. Monitoring Current Activity with Dynamic Management Views (DMVs)
Dynamic Management Views offer real-time information about the state of the data warehouse. Key DMVs in Microsoft Fabric include:
SELECT * FROM sys.dm_exec_connections;sys.dm_exec_connections: Information about data warehouse connections.sys.dm_exec_sessions: Details about authenticated sessions.sys.dm_exec_requests: Data on active requests.
By querying these DMVs, administrators can gain detailed insights into current activities, helping to identify and address long-running queries.
3. Monitoring Query Trends with Query Insights Views
Microsoft Fabric provides query insights feature that includes views like:
SELECT * FROM queryinsights.exec_requests_history;queryinsights.exec_requests_history: Details on each completed SQL query.queryinsights.long_running_queries: Information on query execution times.queryinsights.frequently_run_queries: Data on frequently run queries.
These insights are essential for analyzing and tuning query performance. They enable administrators to identify frequently used or long-running queries, enhancing overall efficiency.
Hands-on Data Warehouse in Microsoft Fabric:
-
Creating a Workspace in Microsoft Fabric:
- Access Requirements: Use a Microsoft school or work account. If you don’t have one, sign up for a trial of Microsoft Office 365 E3 or higher.
- Workspace Setup: On the Microsoft Fabric home page, select “Synapse Data Warehouse.” Then, in the menu, choose “Workspaces” (icon resembling 🗇) and create a new workspace. Opt for a licensing mode that includes Fabric capacity such as Trial, Premium, or Fabric.
-
Establishing a Data Warehouse:
- Initiating a Warehouse: In your new workspace, navigate to the Synapse Data Warehouse home page and follow the steps to create a new data warehouse.
-
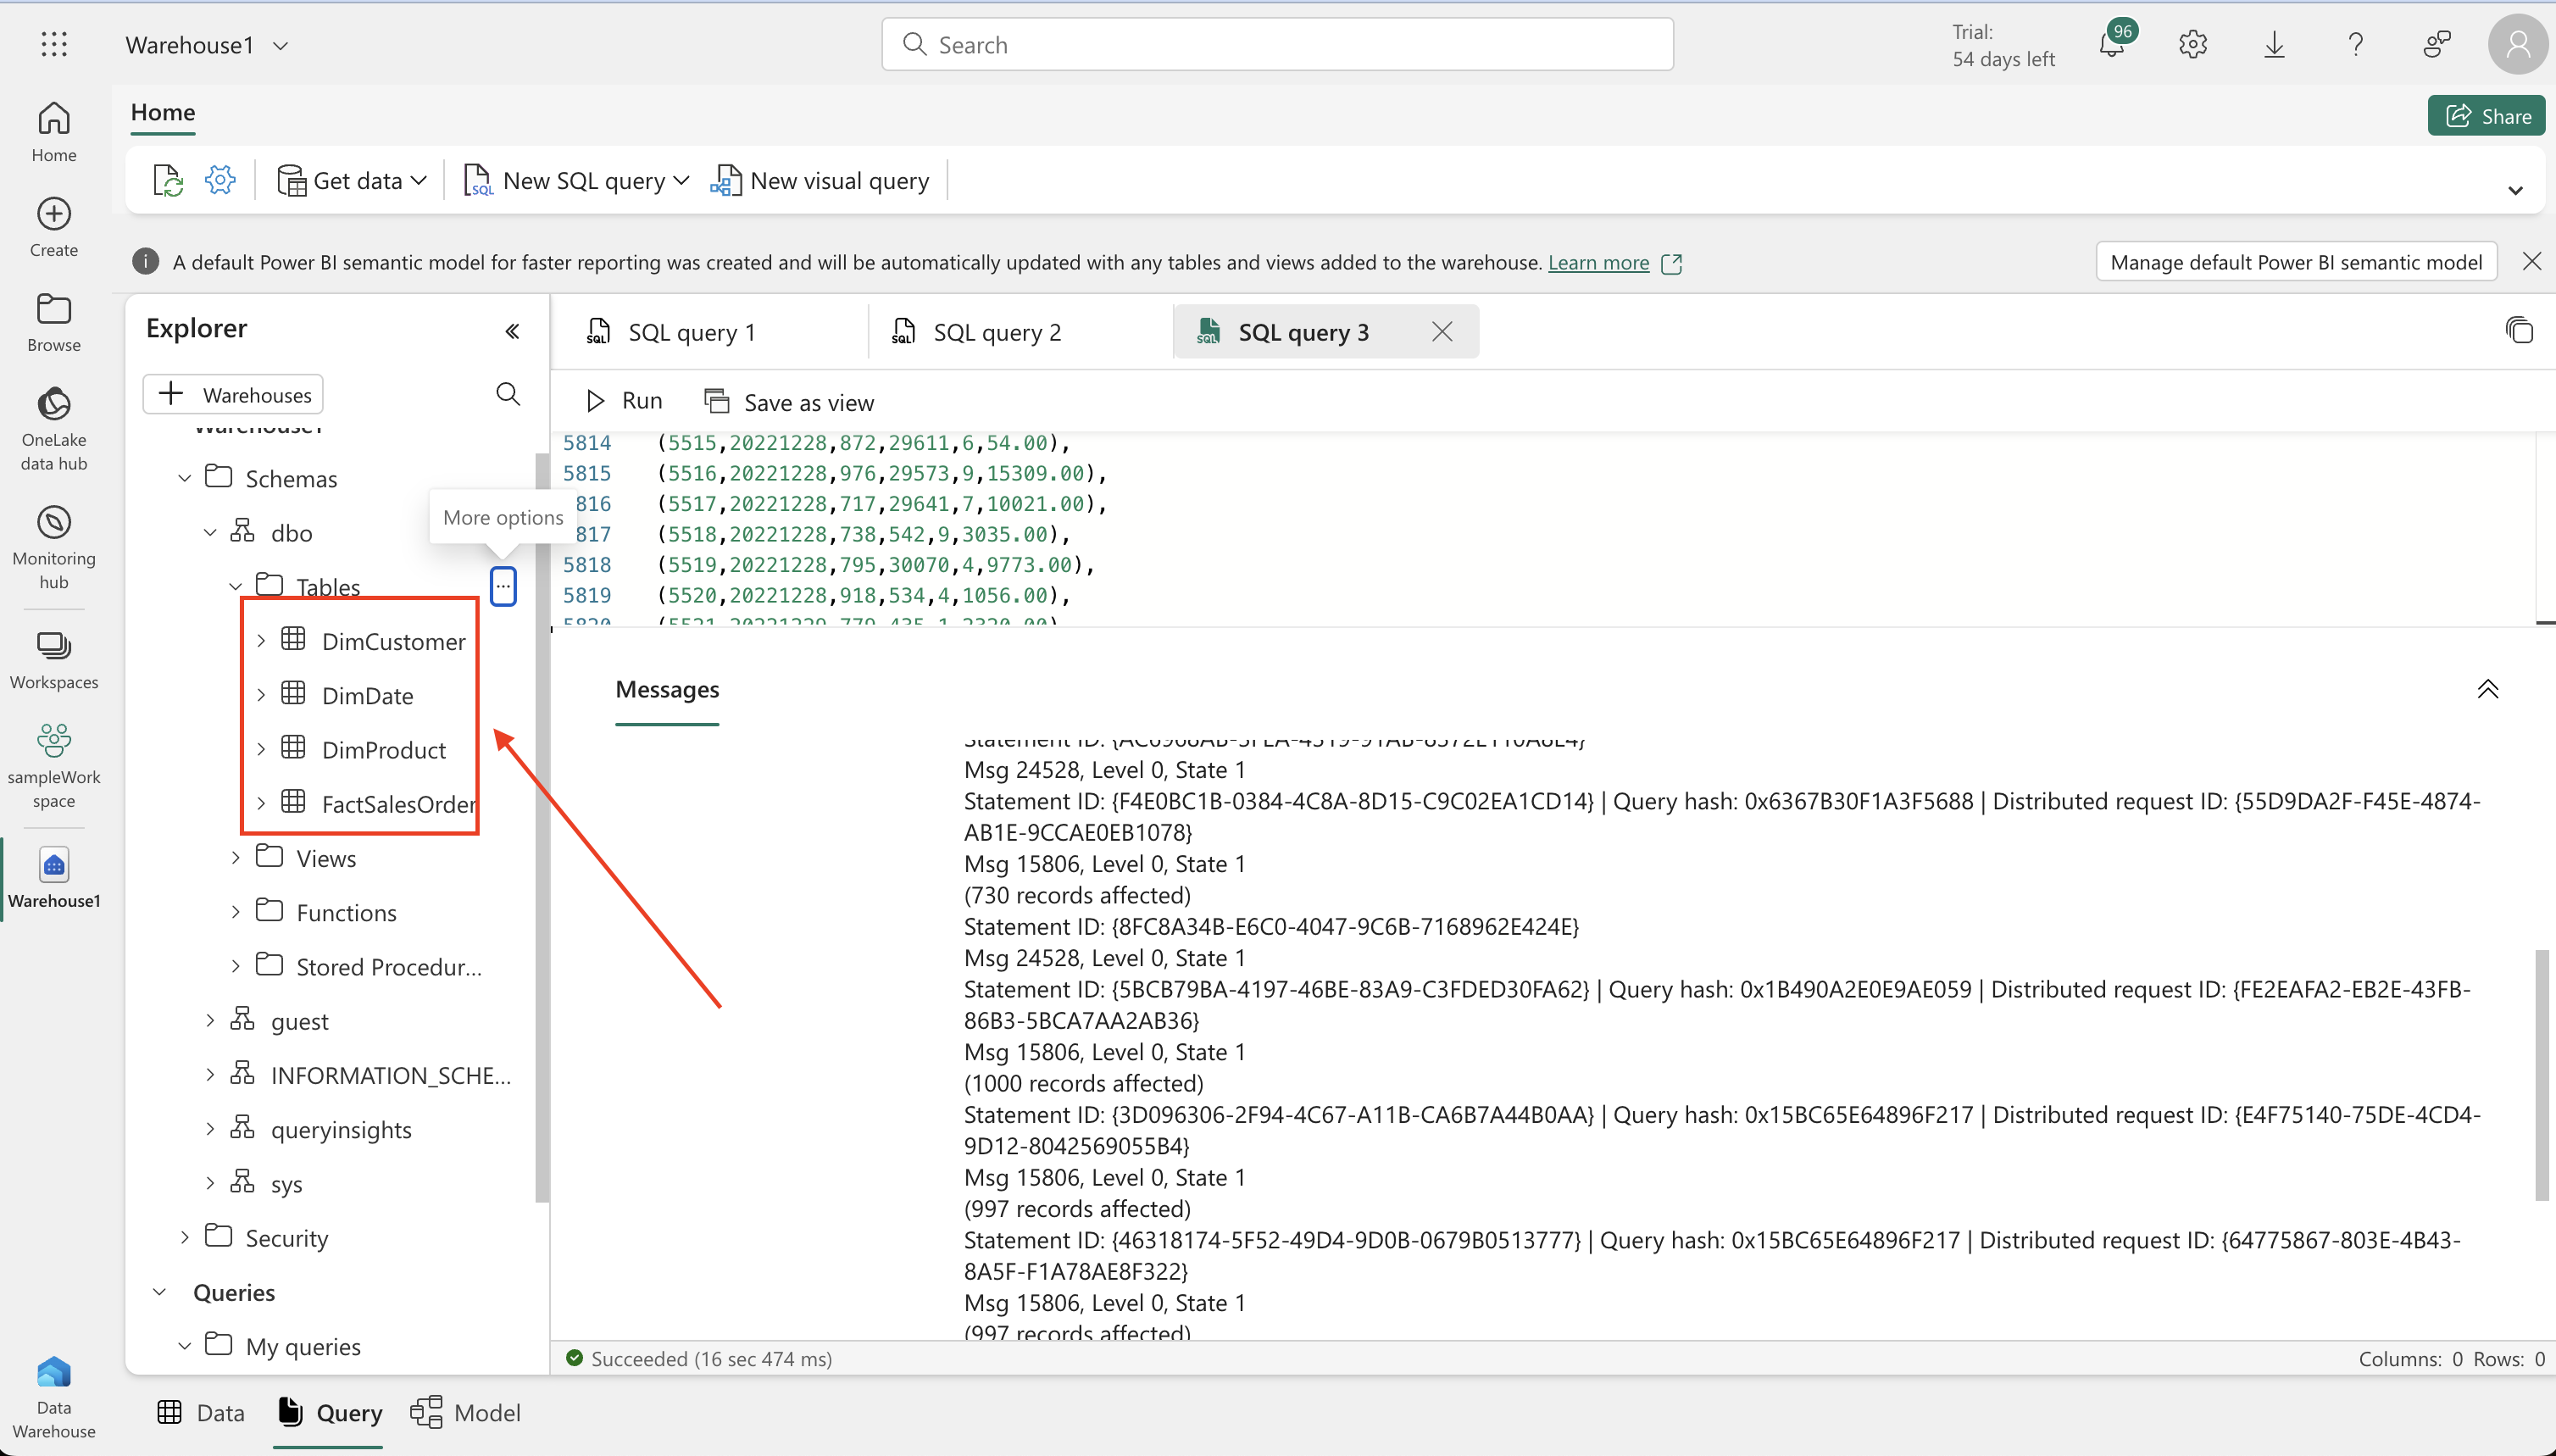
Table Creation and Data Insertion:
- Creating Tables: In your warehouse, use T-SQL to create a ‘DimProduct’ table with various fields like ProductKey, ProductName, and ListPrice.
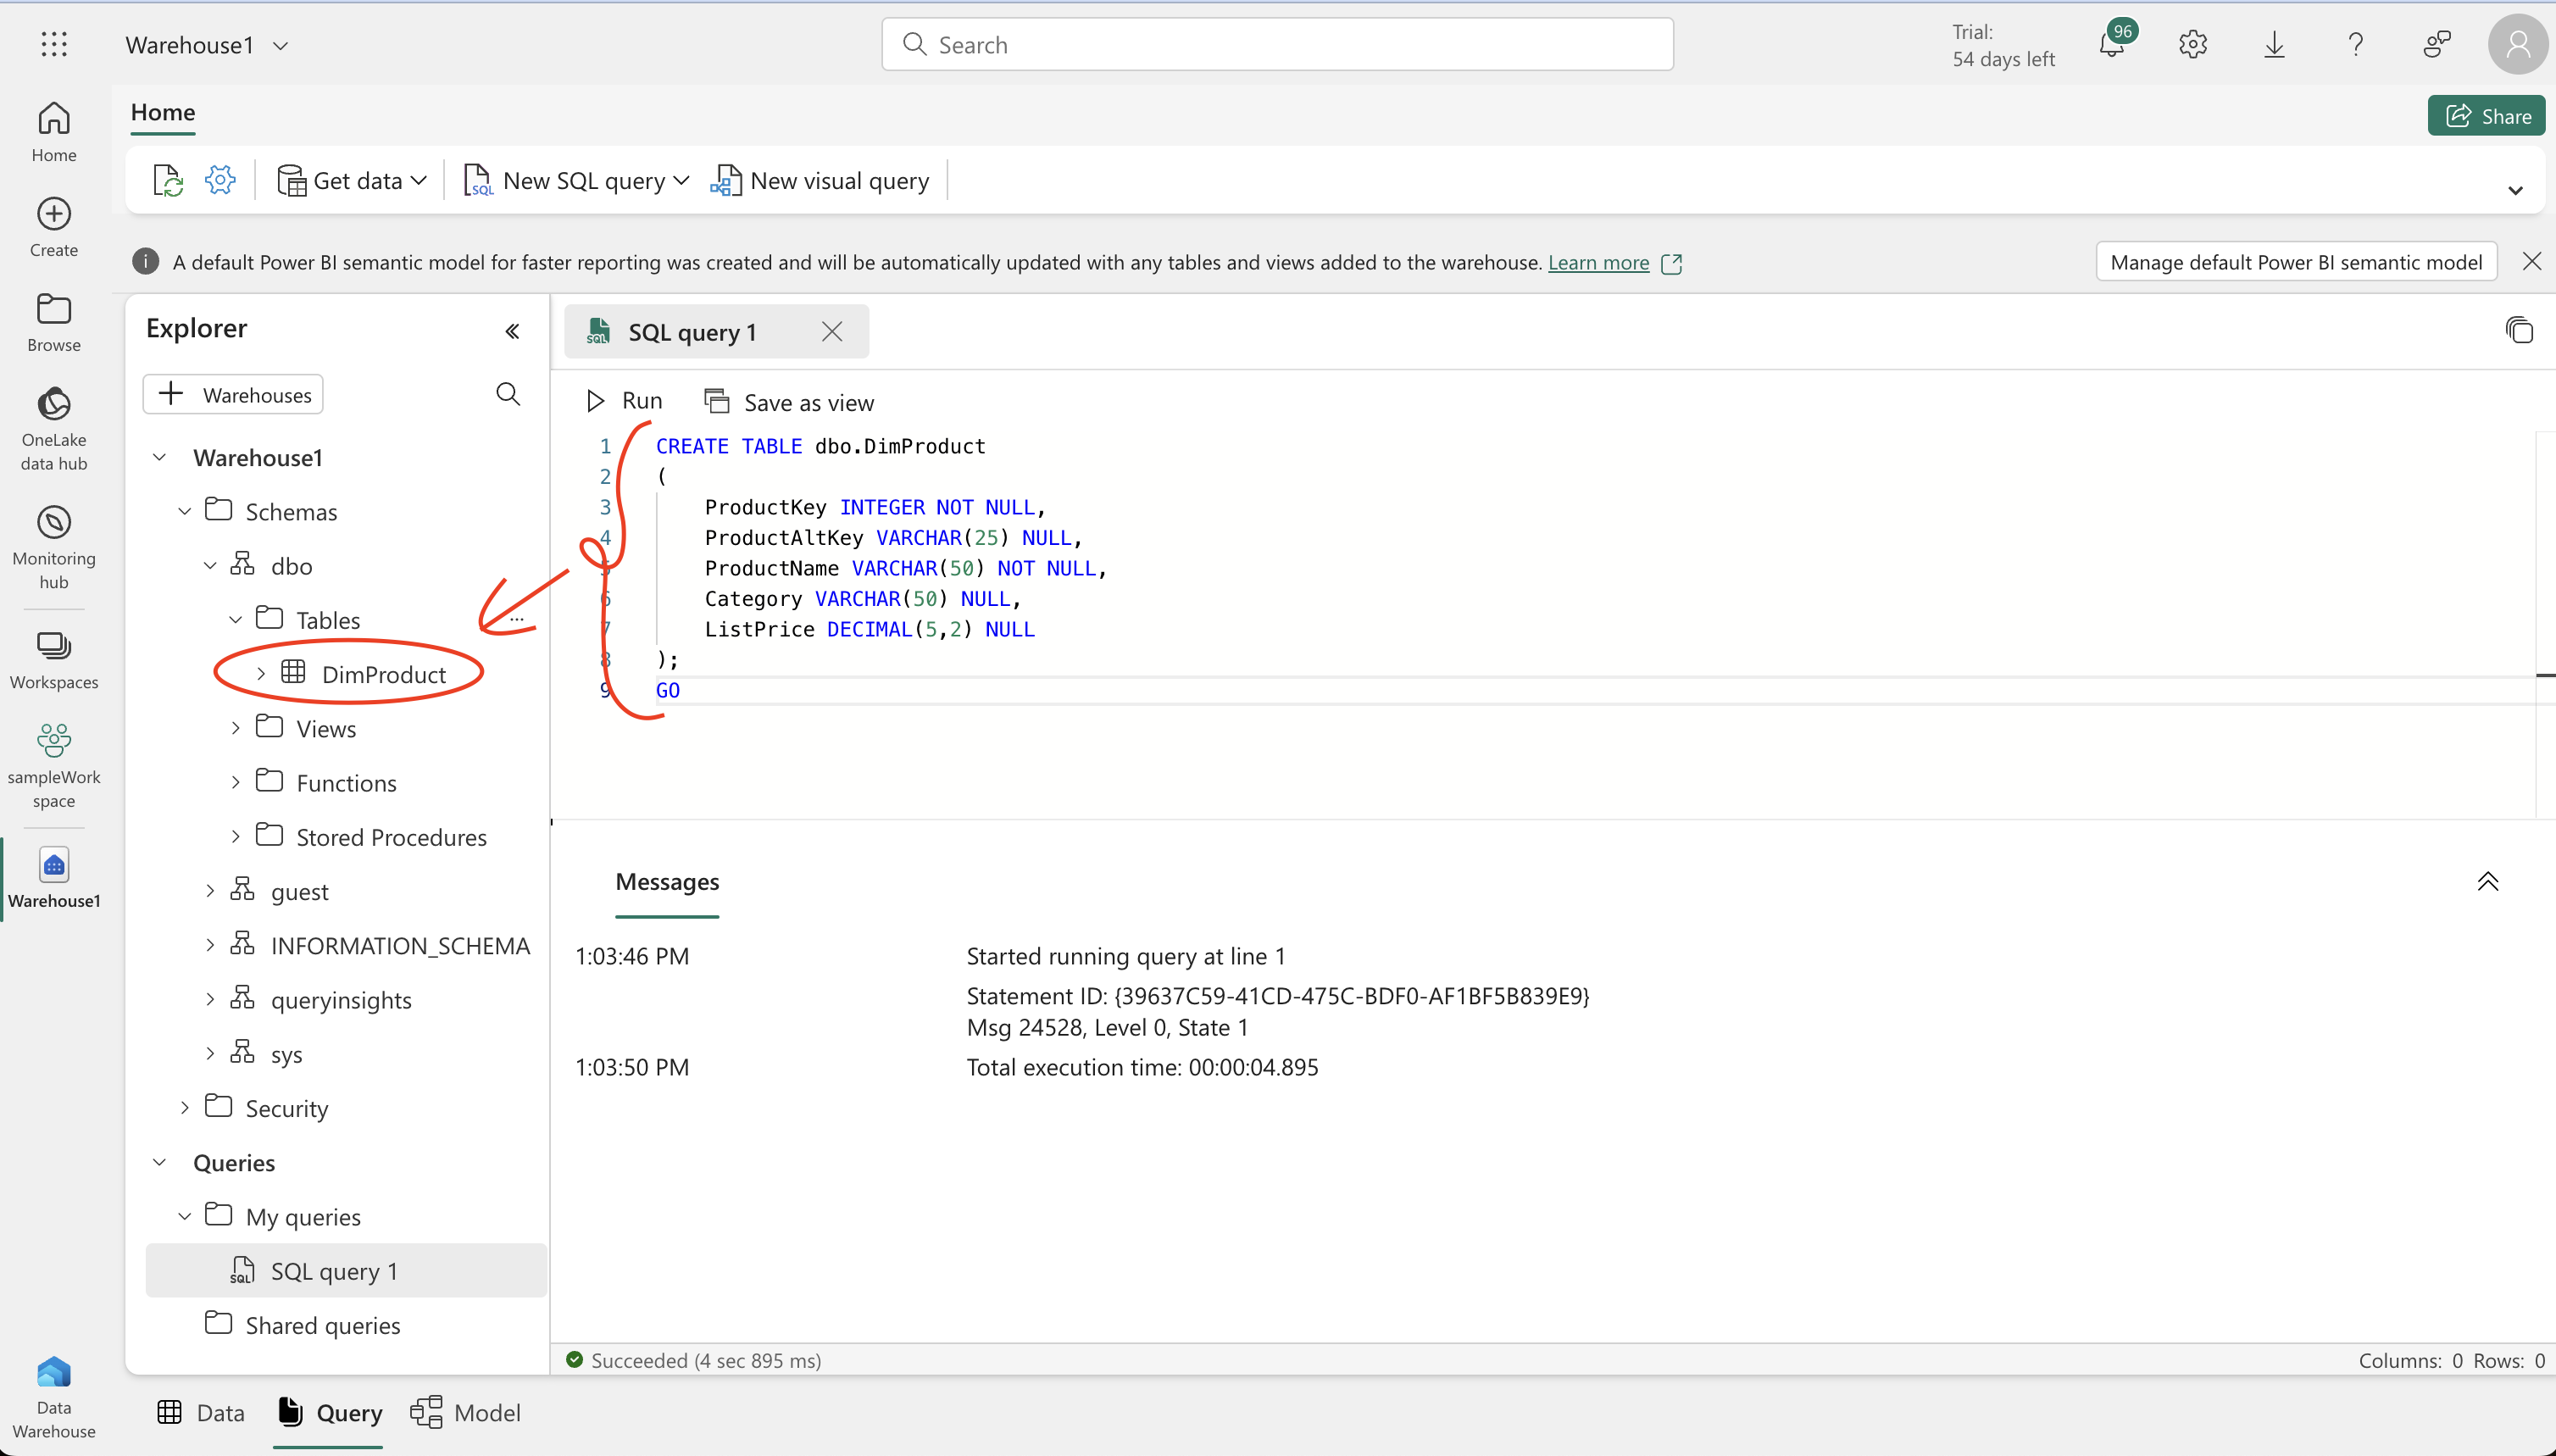
- Inserting Data: Run an INSERT SQL script to add sample data into the ‘DimProduct’ table. Refresh the view and check the Explorer pane to ensure the table is created and populated.
-
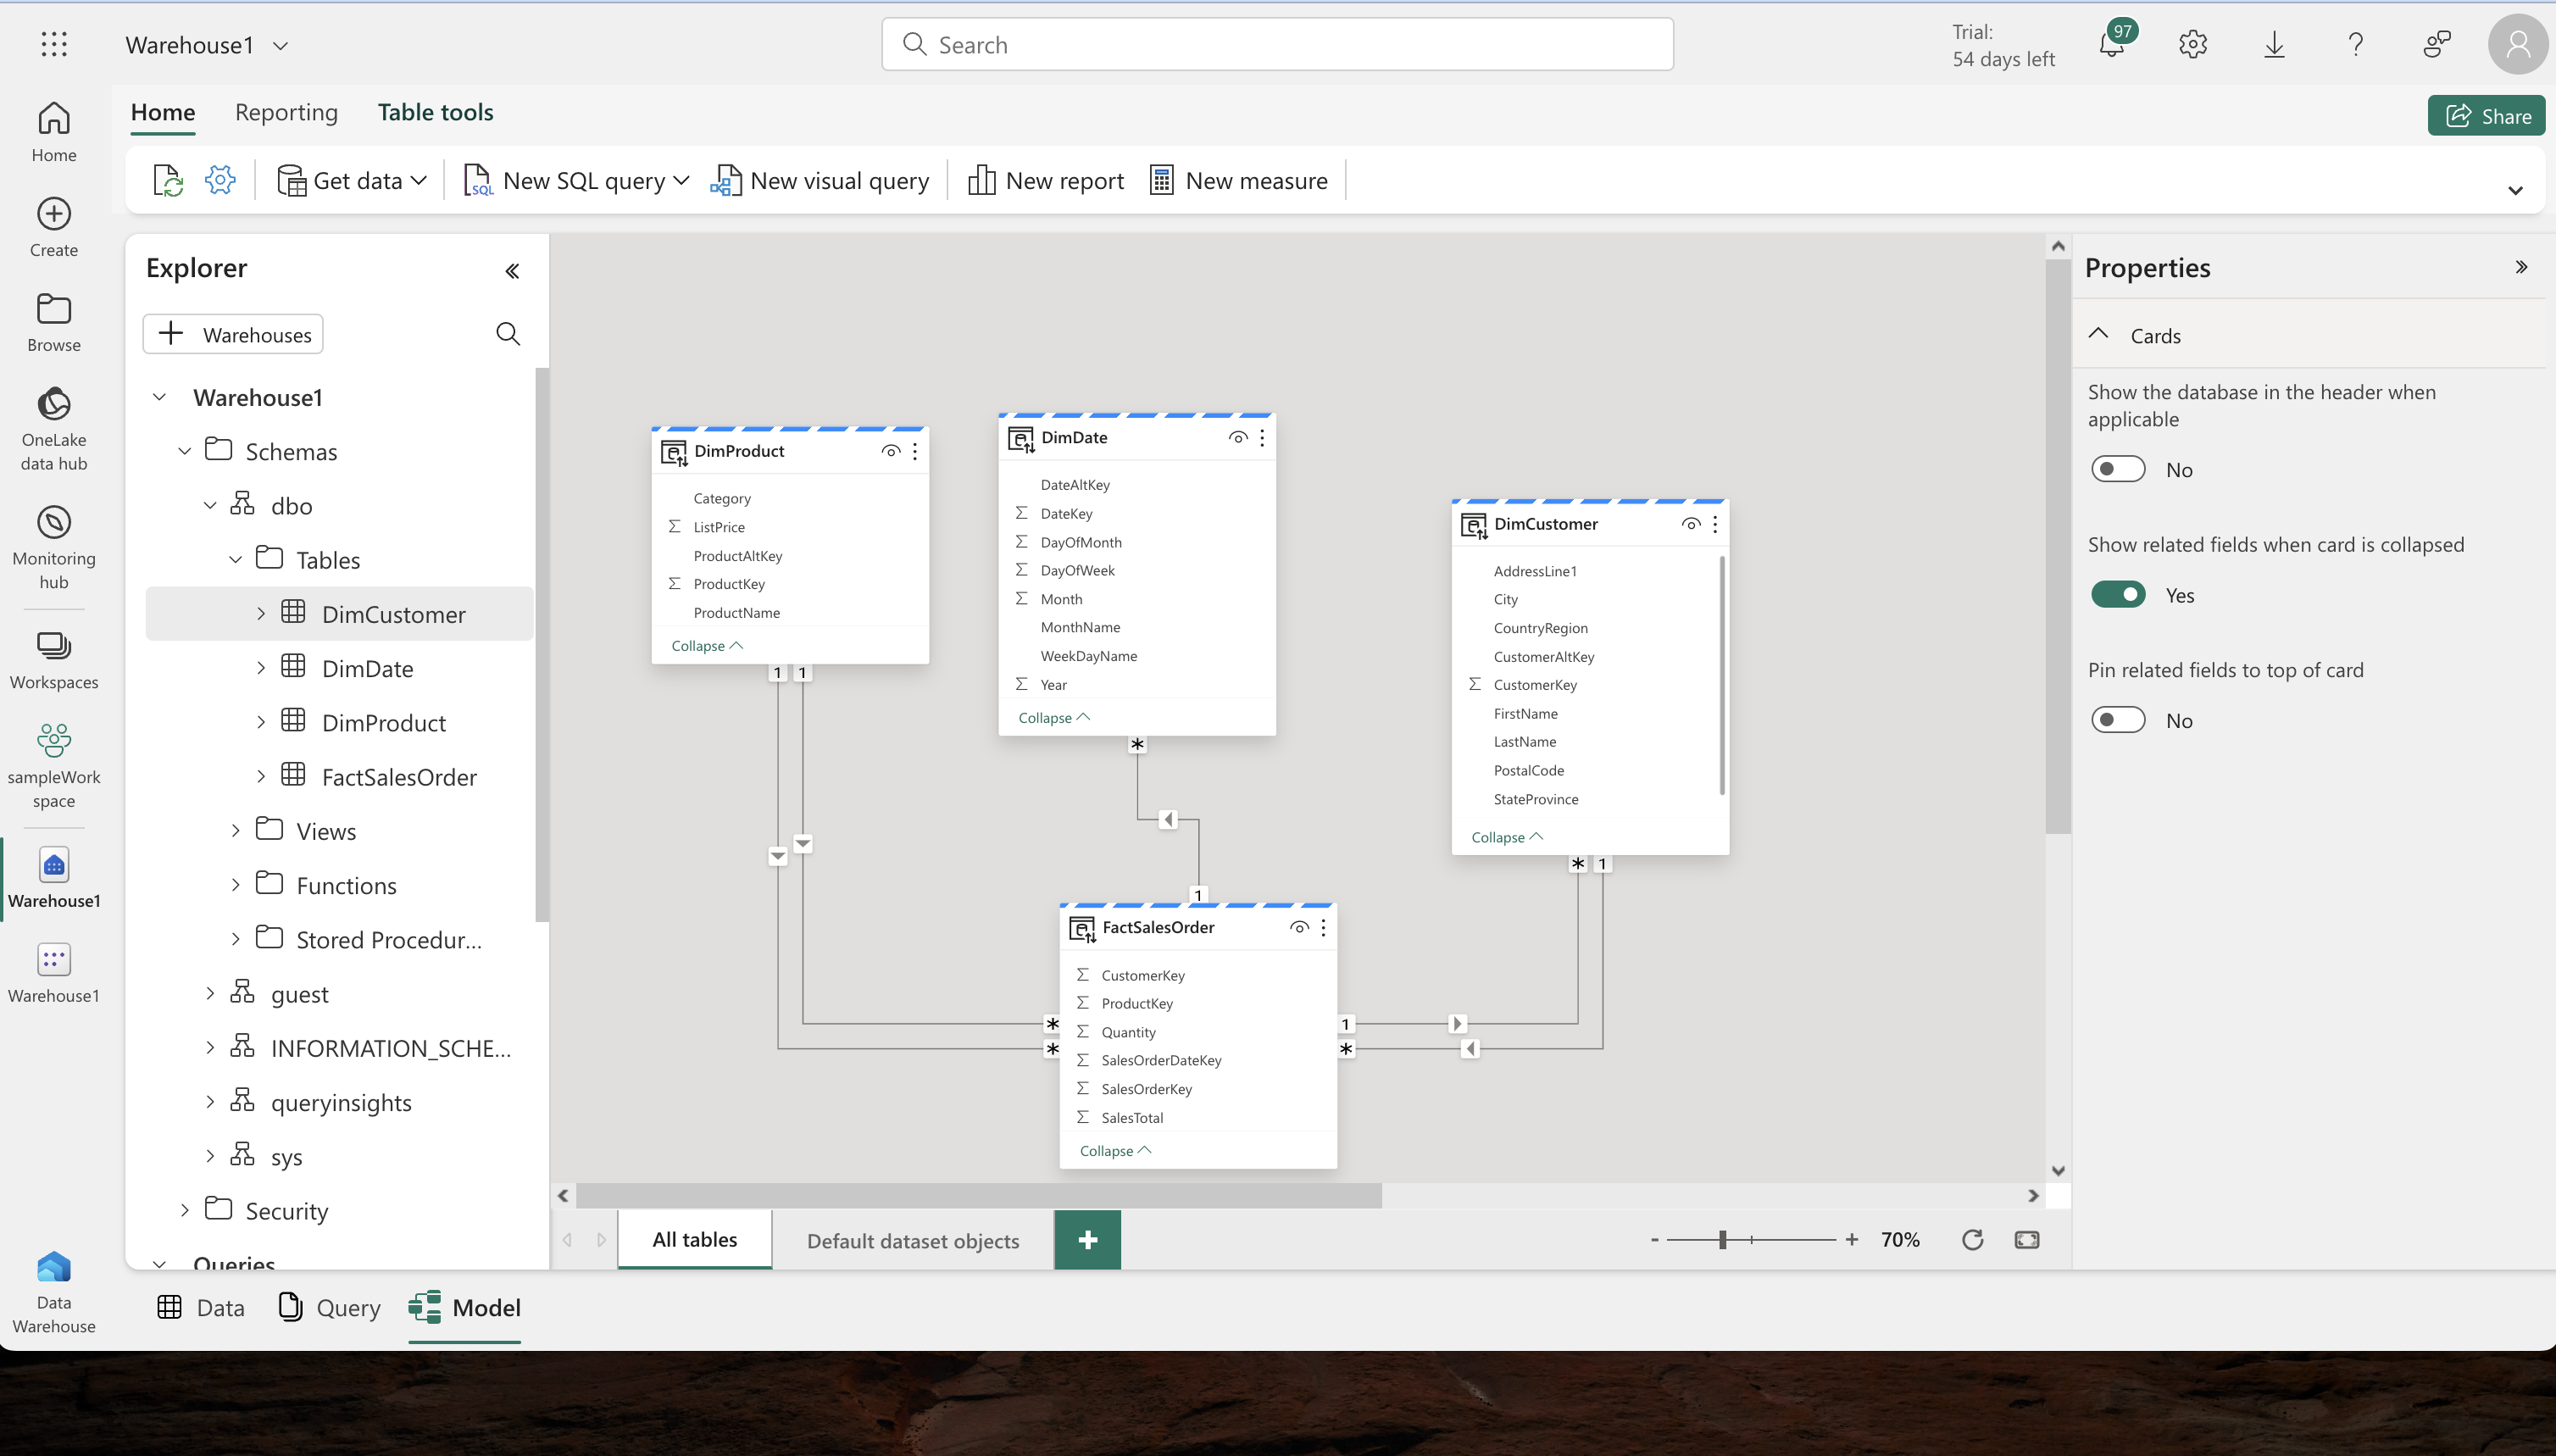
Data Model Definition:
- Model Setup: In the data warehouse’s Model tab, organize the tables, placing the FactSalesOrder table centrally.
- Defining Relationships: Establish many-to-one relationships between tables like FactSalesOrder and DimProduct by dragging and dropping key fields to link them.
-
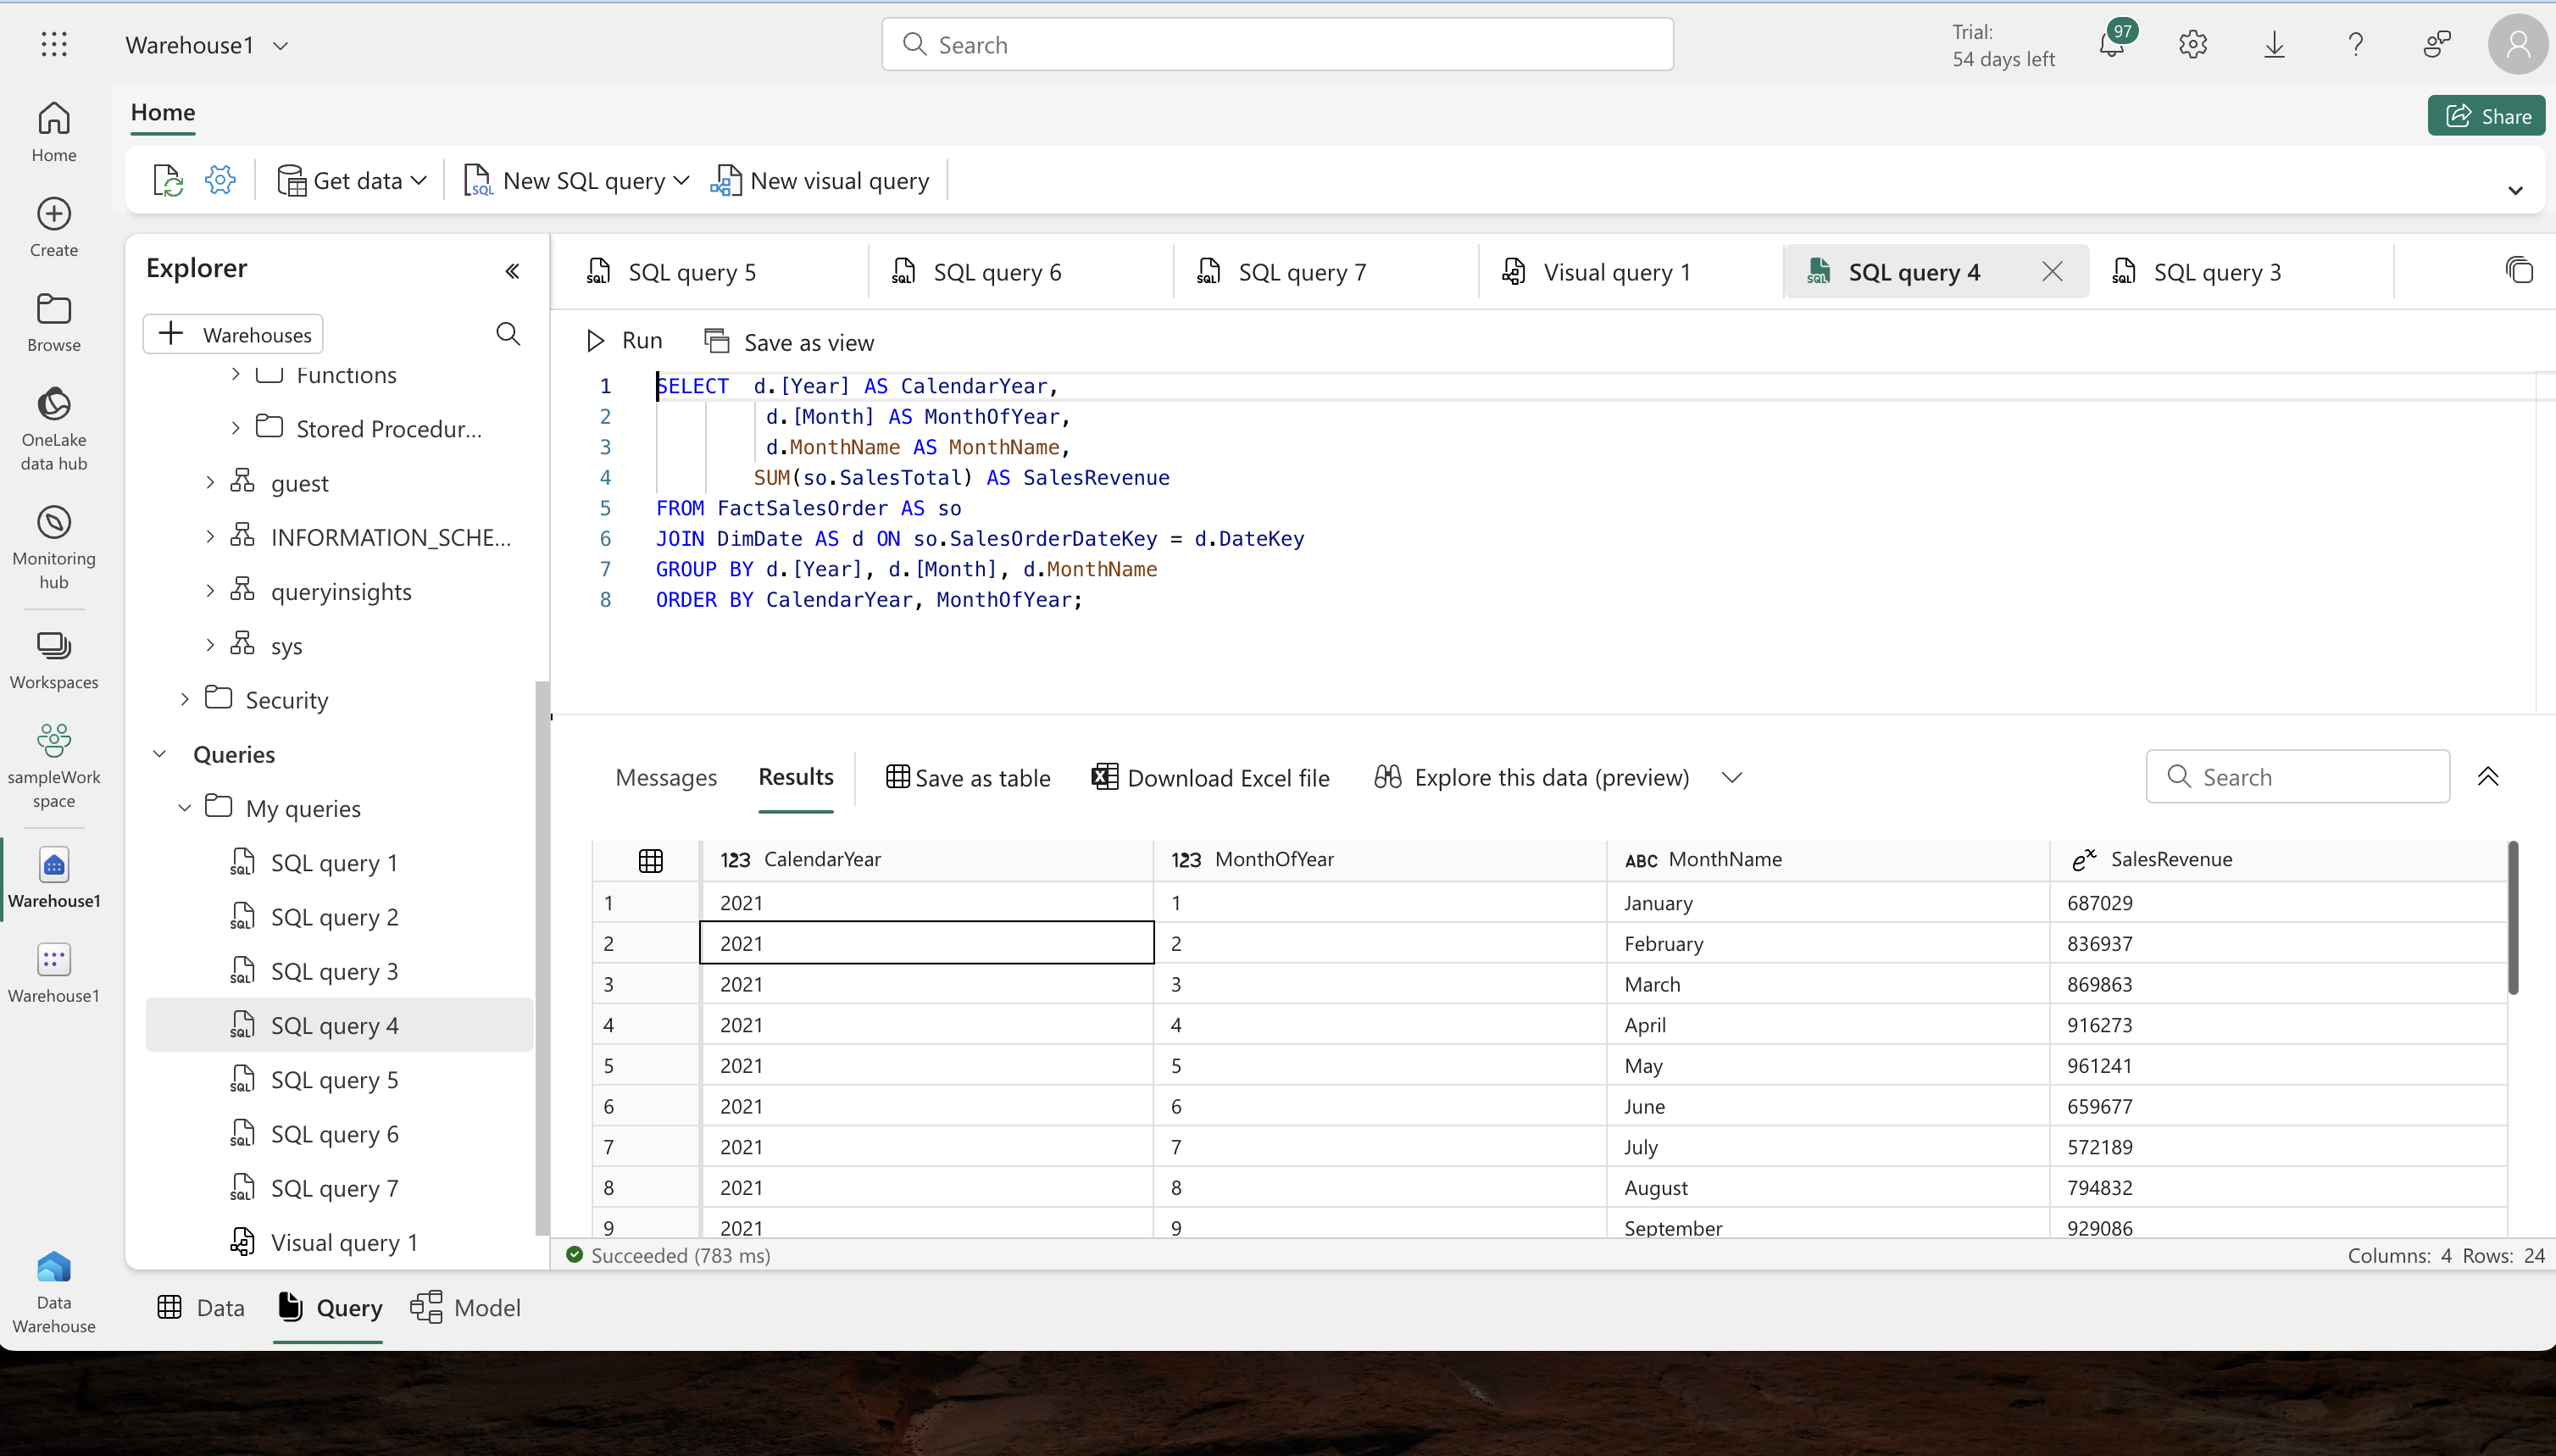
Querying the Warehouse:
- Basic Queries: Start with simple SQL queries to aggregate and group data.
- Advanced Queries: Modify your queries to add more dimensions, such as grouping by sales region, to get more detailed insights.
-
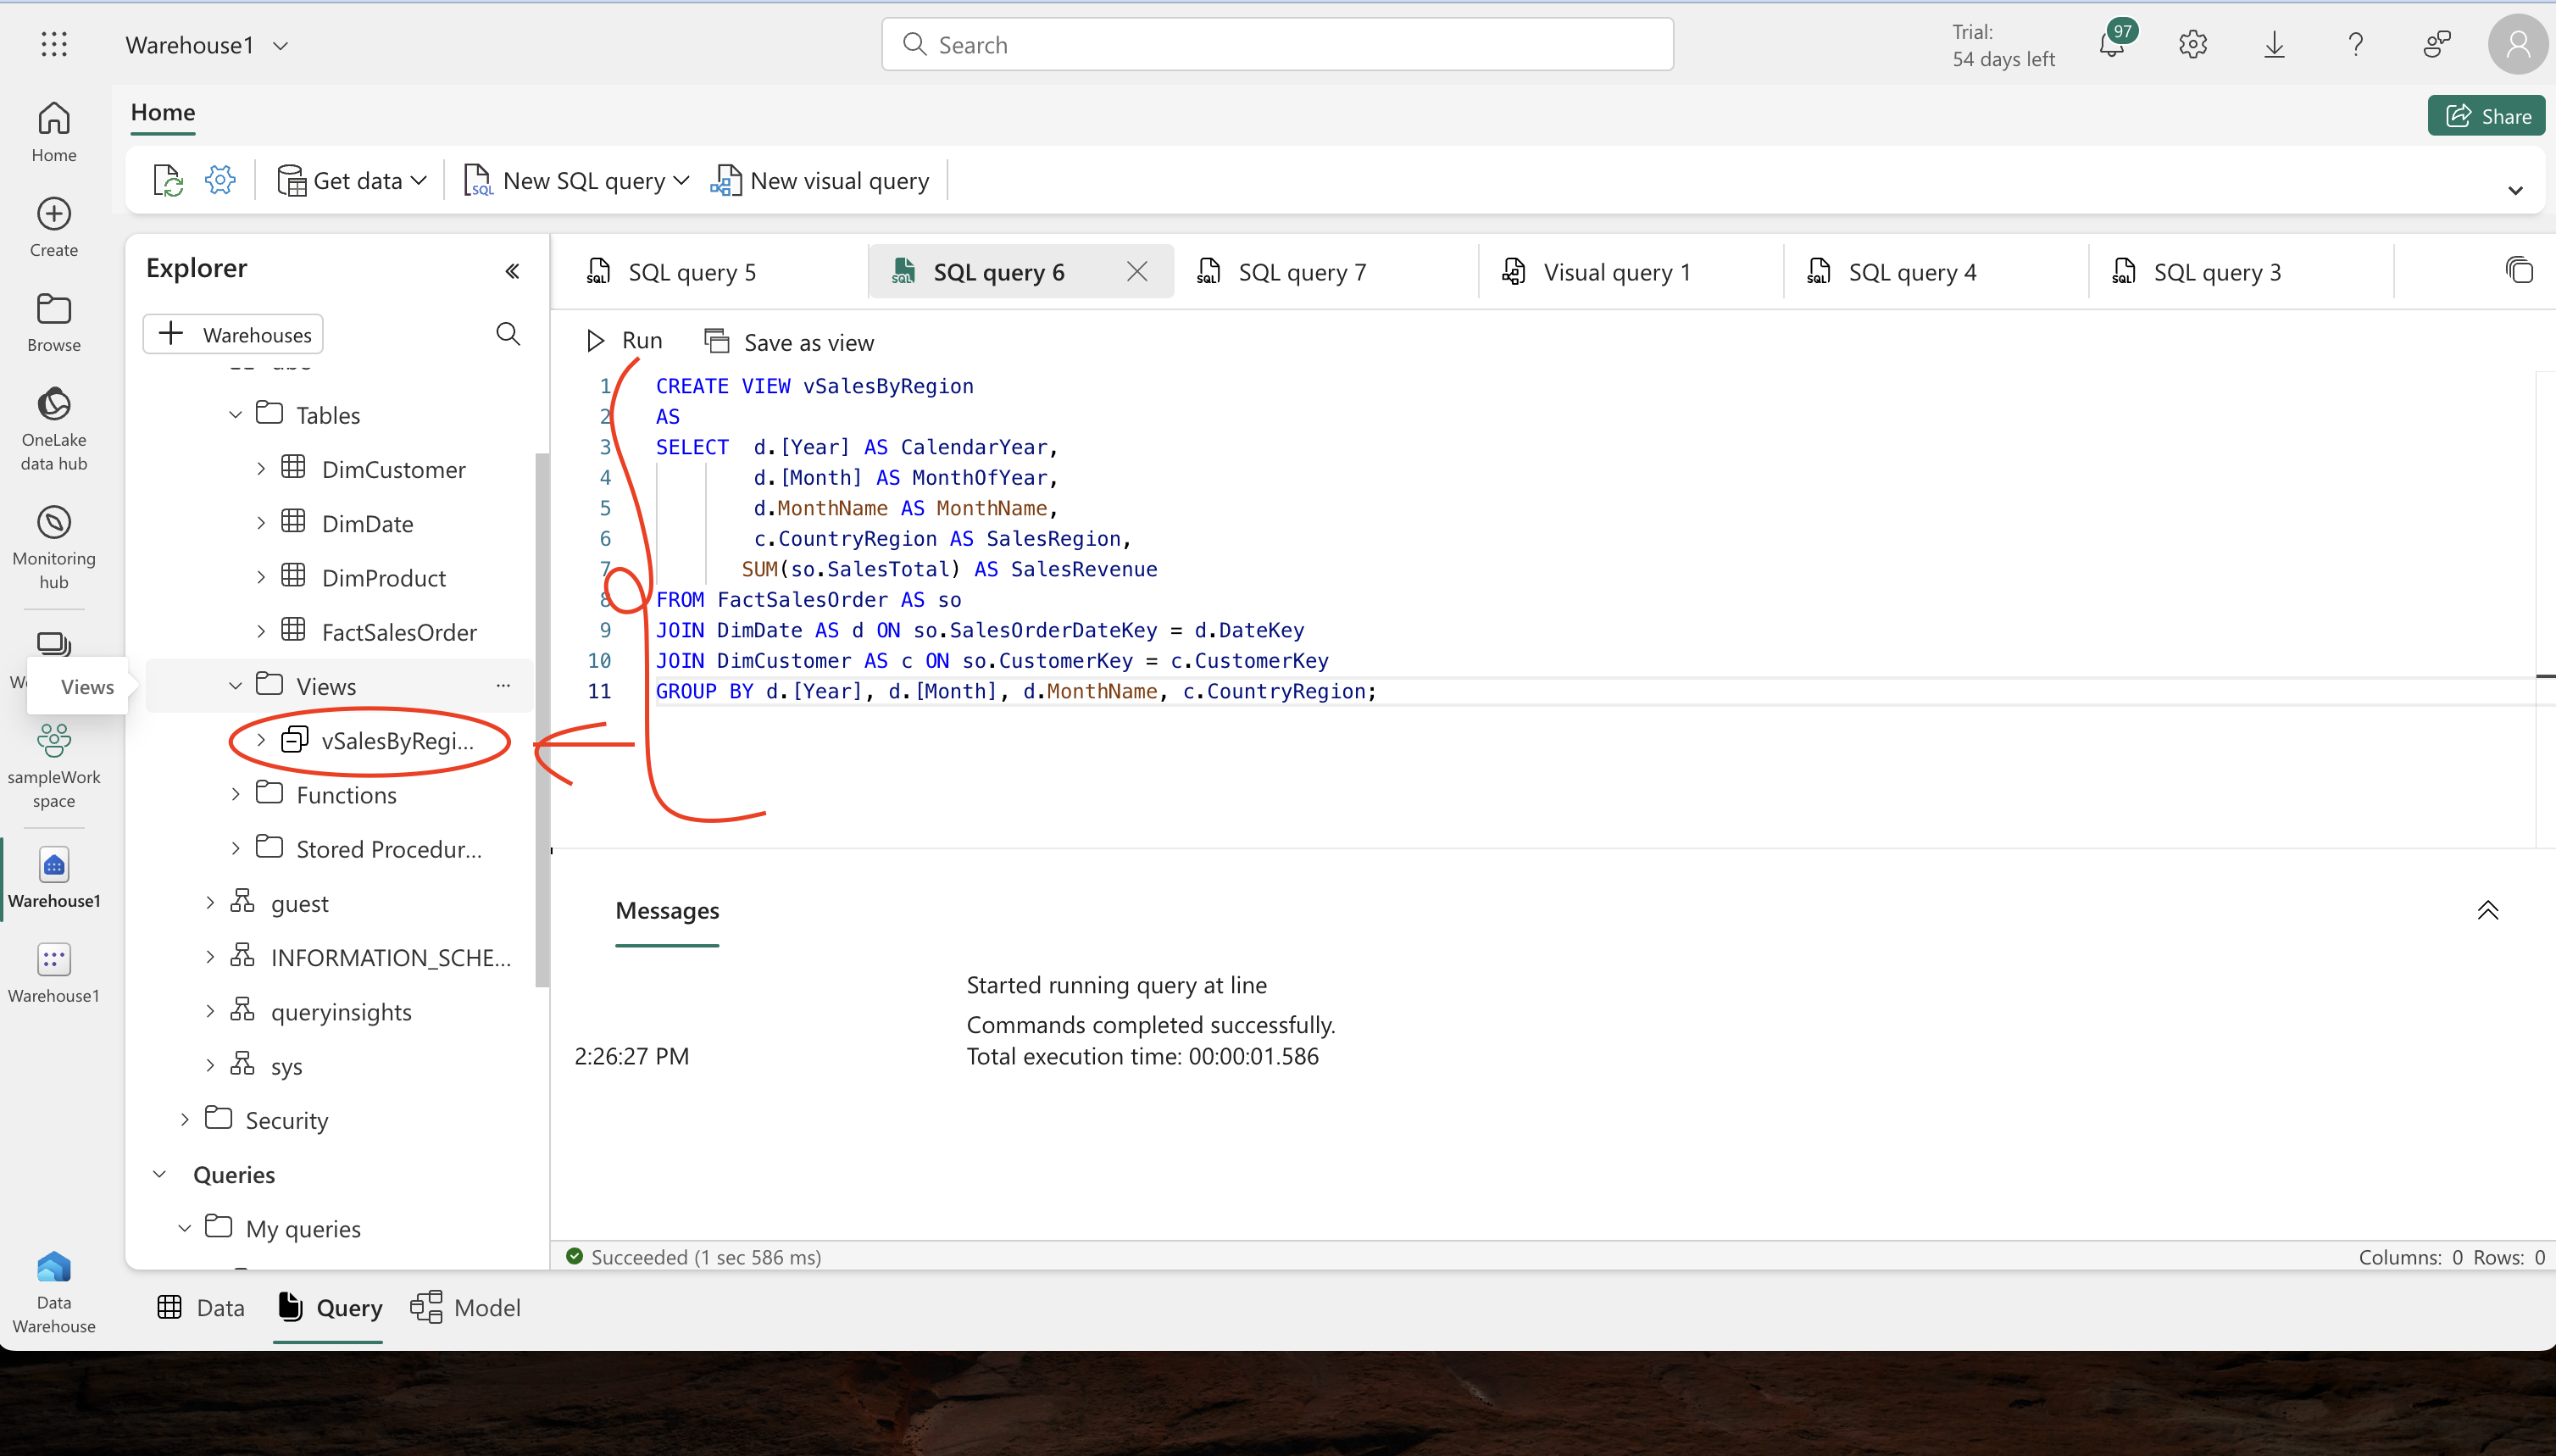
Creating and Implementing Views:
- View Creation: Convert your SQL queries into a view, ‘vSalesByRegion’, by modifying the query and removing the ORDER BY clause.
- Utilizing Views: Use a SELECT statement to retrieve data from this view, refining your data representation.
-
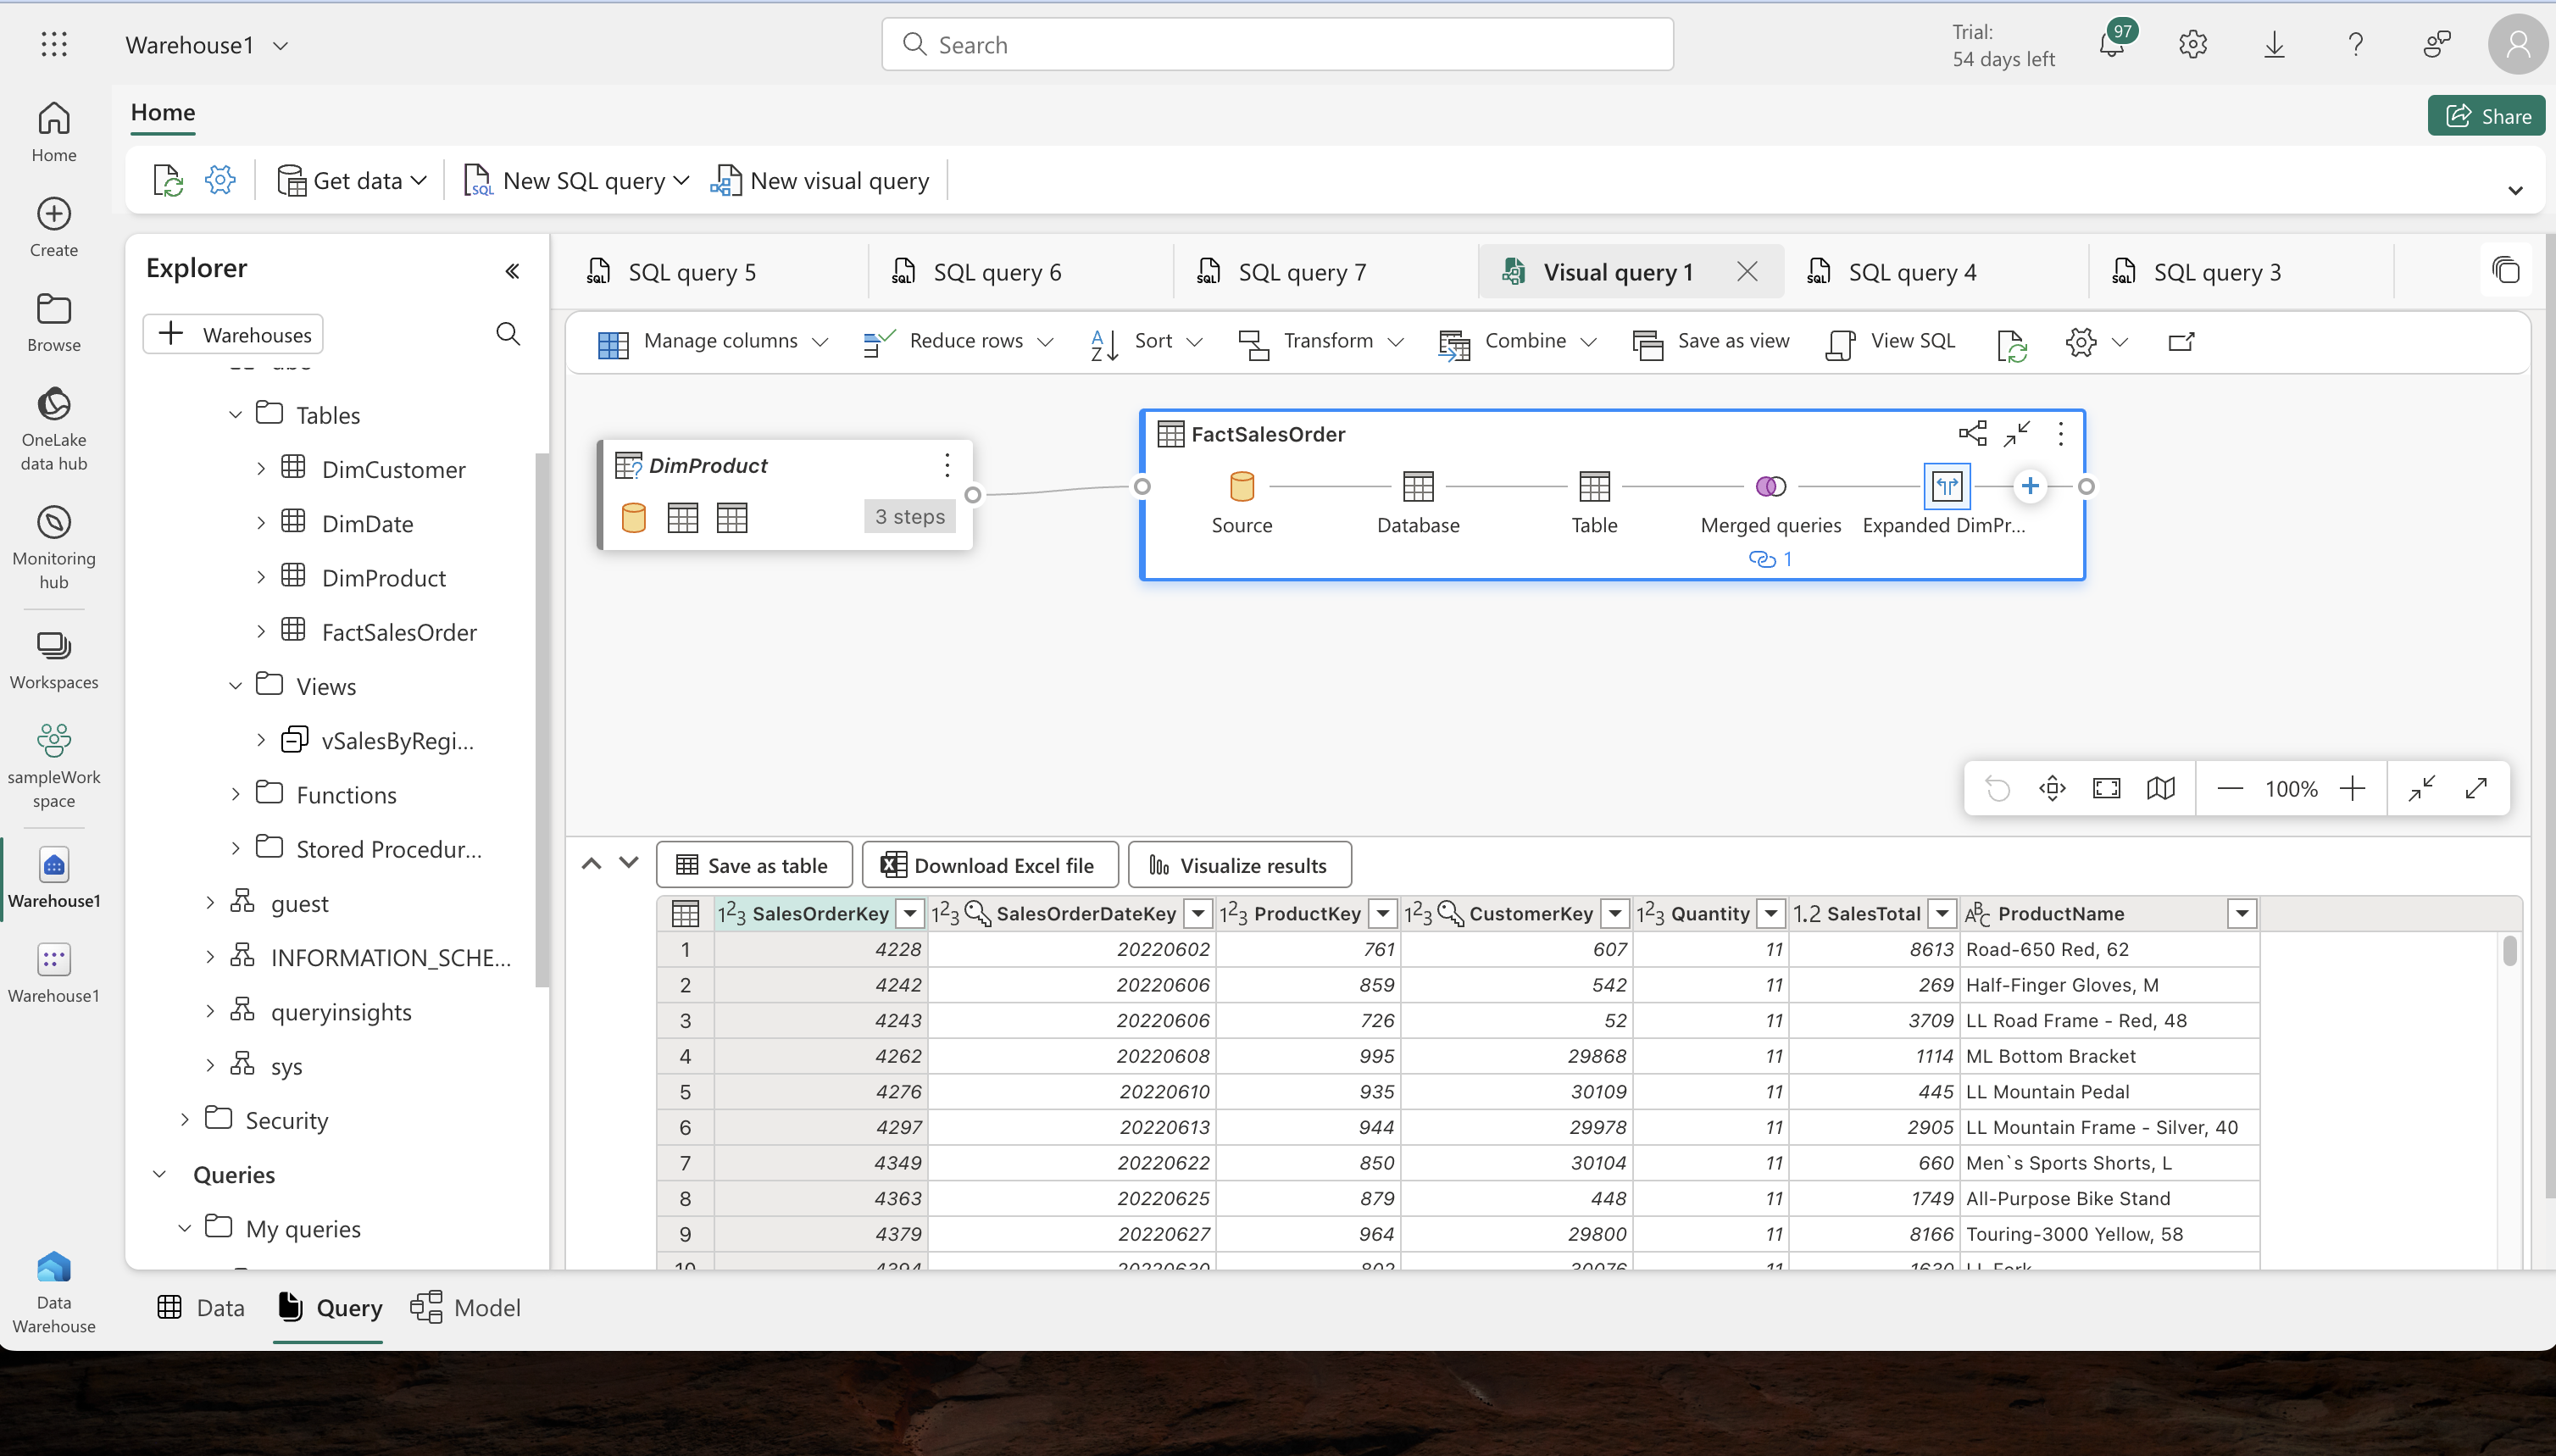
Visual Query Development:
- Graphical Query Designing: Use the graphical query designer to merge queries and apply filters without writing code.
- Filtering Data: Apply filters to focus on specific data, such as data for a single product as requested by a manager.
-
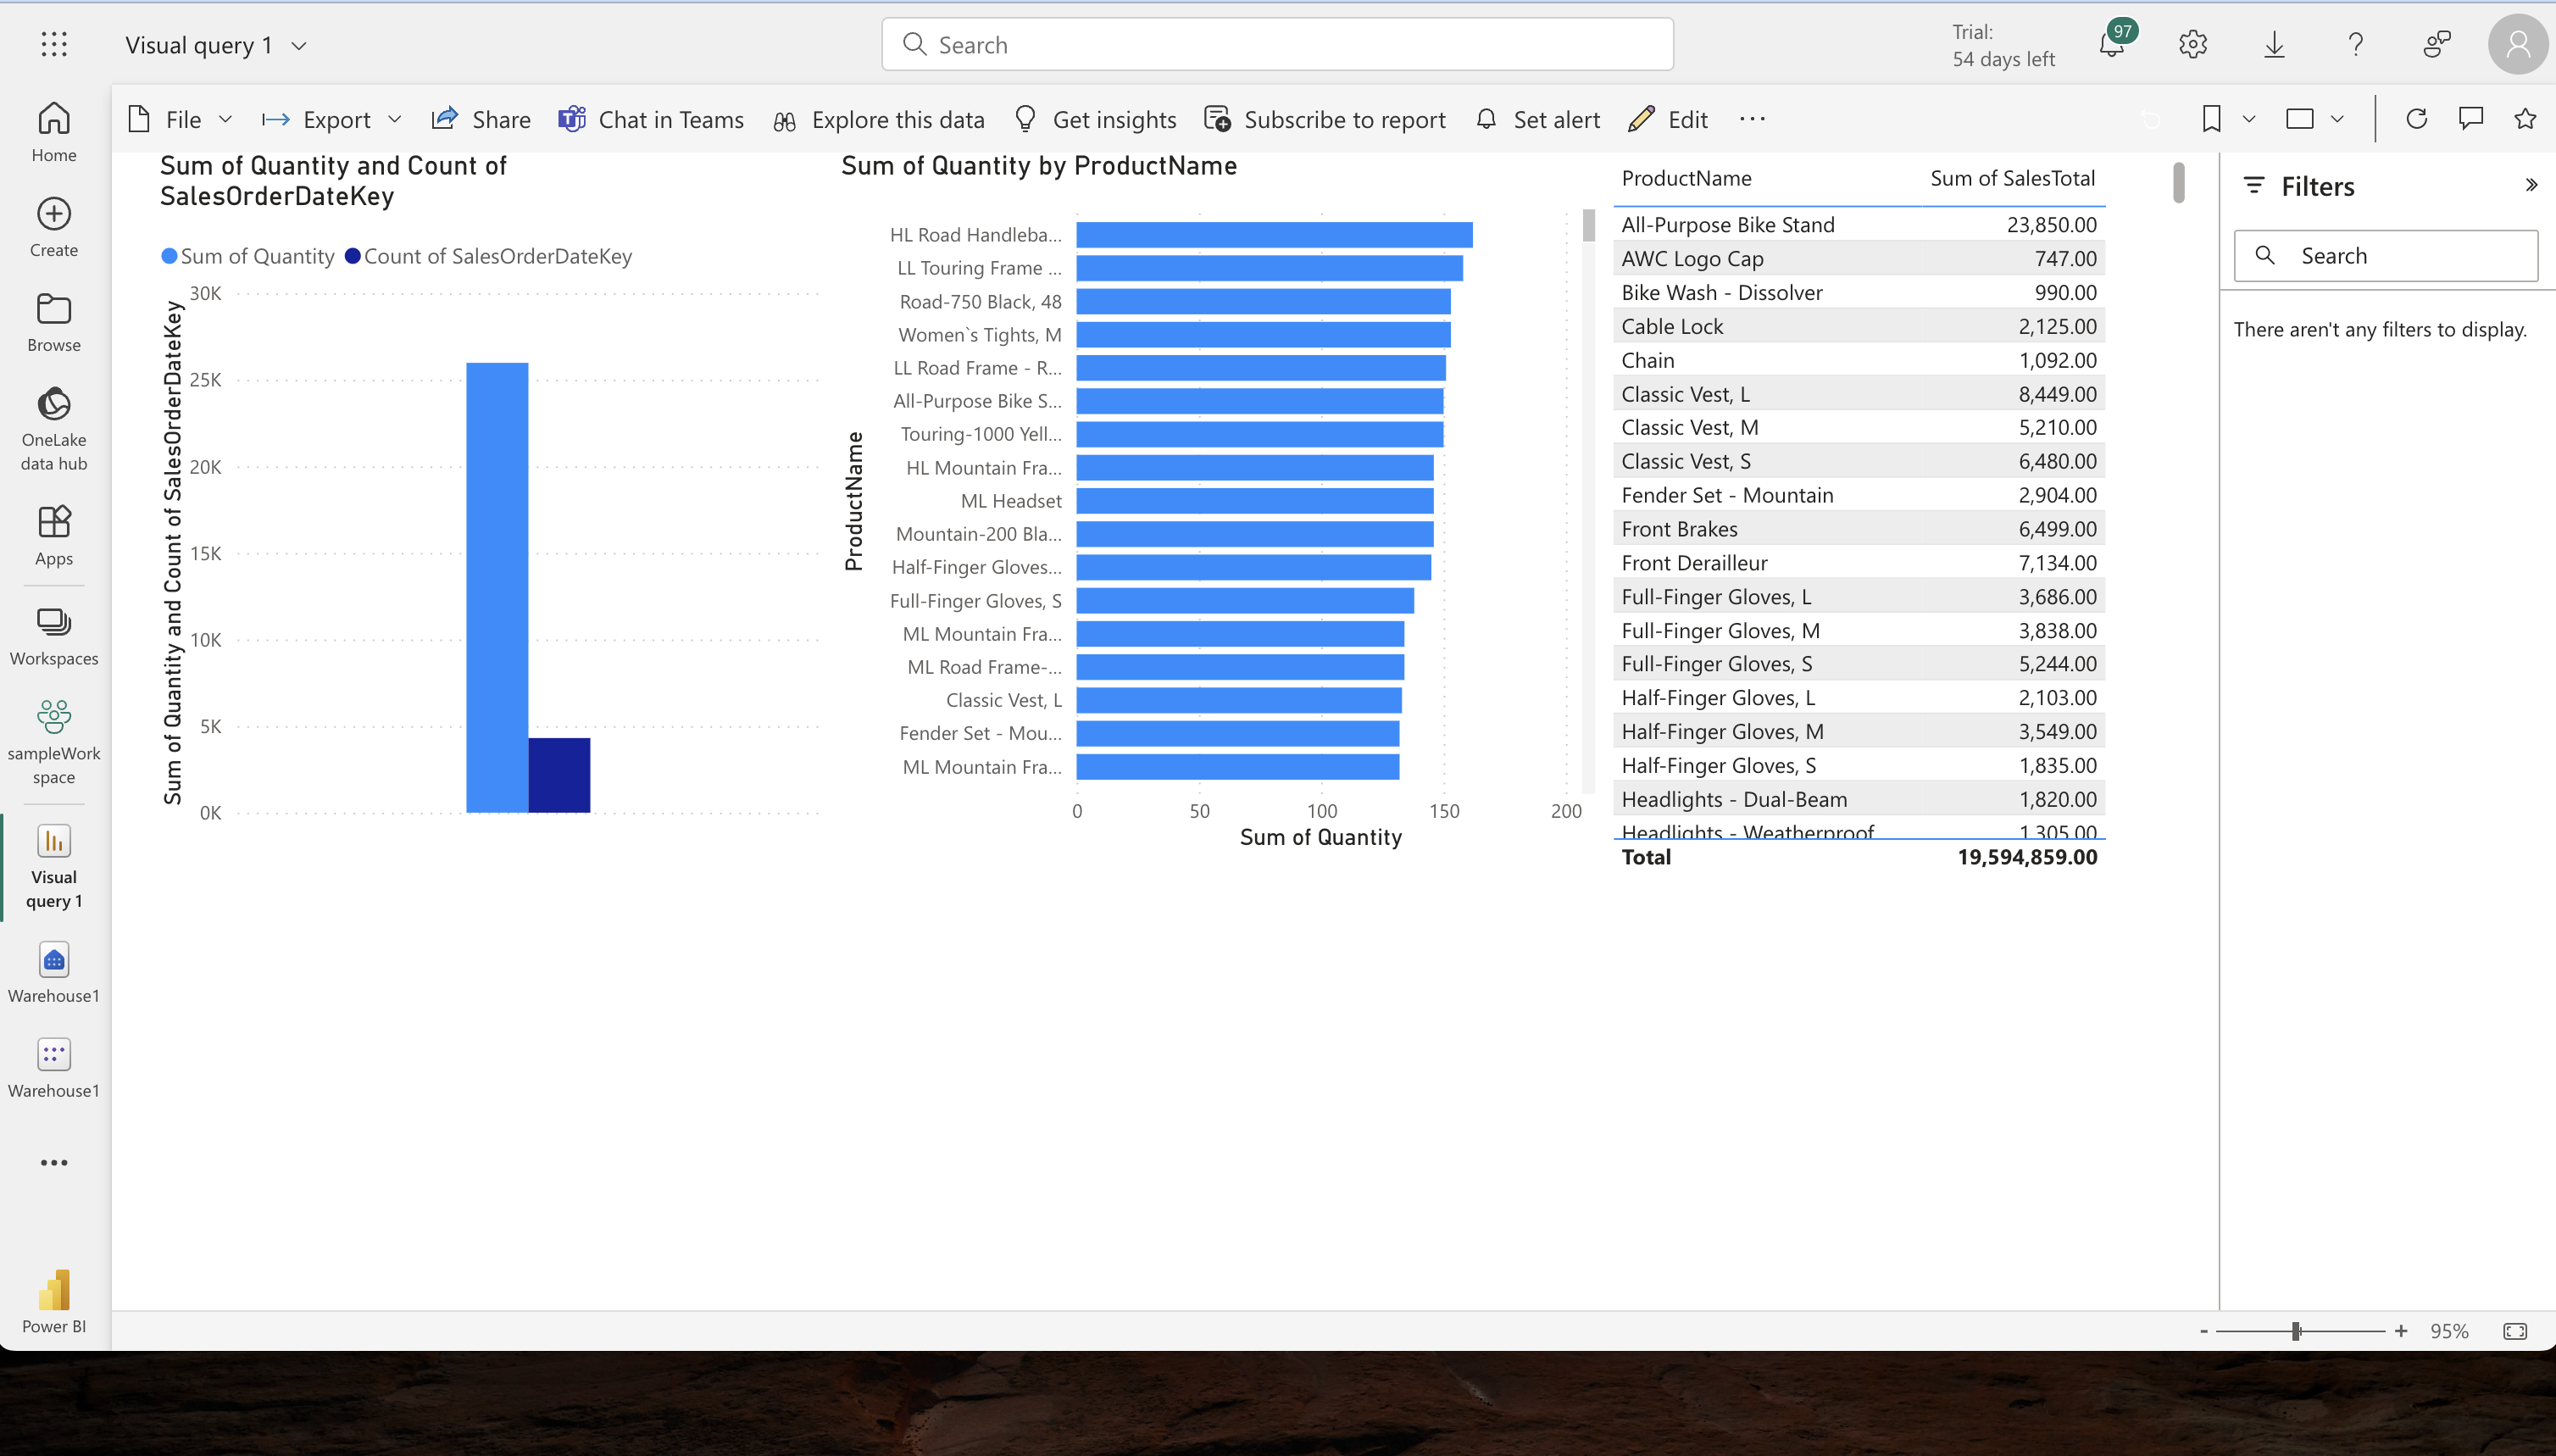
Data Visualization:
- Preparation for Reporting: In the Model view, hide unnecessary columns from the Fact and Dimension tables to simplify the report design.
- Report Creation: Build a Power BI report using selected data, choosing appropriate visual types and customizing titles.
-
Finalization and Review:
- Saving the Report: Save the report as ‘Sales Report’ in your workspace.
- Workspace Review: Return to the workspace to verify the presence of your data warehouse, dataset, and the newly created report.