DataFlows (Gen2) in Microsoft Fabric
Explore how Microsoft Fabric's Dataflows (Gen2) revolutionizes data engineering in the retail industry with global operations. This essential tool simplifies the extraction, transformation, and loading (ETL) processes, making it an invaluable asset for data engineers. Discover its key features, advantages, and limitations, and learn how to create workspaces, lakehouses, and dataflows for efficient data ingestion.

DataFlows (Gen2) in Microsoft Fabric
Microsoft Fabric’s Dataflows (Gen2) is an essential tool for data engineers, particularly in the retail industry with global operations. It simplifies the process of ingesting and transforming data from various sources, making it suitable for analysis and reporting. By consolidating disparate data sources from different stores, Dataflows (Gen2) ensures data consistency and facilitates easy staging in the preferred destination. This tool is especially valuable as it eliminates the need for manual data extraction and transformation, saving time and reducing errors. In this guide, we’ll delve into how Dataflows (Gen2) can be effectively used in Microsoft Fabric to streamline your data ingestion tasks.
What is Dataflow (Gen2):
Dataflows in Microsoft Fabric’s Gen2 offer a simplified, efficient approach for handling ETL (Extract, Transform, Load) processes. This cloud-based tool allows for the extraction of data from multiple sources, its transformation through various operations, and loading it into chosen destinations, like a Lakehouse. Power Query Online enhances this experience with a user-friendly, visual interface.
Key Uses and Methods:
- Dataflows reduce the time spent by data engineers on ETL tasks, making data readily available for downstream analytics.
- They can be used independently or integrated into a Data Pipeline, offering flexibility in data processing and destination.
- The tool supports both ETL and ELT (Extract, Load, Transform) processes, accommodating different workflow preferences.
- Dataflows can be partitioned to cater to specific analytical needs, promoting reusable ETL logic and reducing the need for multiple data source connections.
Advantages:
- They standardize data, providing consistent, quality datasets.
- Dataflows facilitate self-service access to subsets of data warehouse information.
- Performance is optimized by enabling data to be extracted once and reused, which is particularly beneficial for slow data sources.
- The low-code interface simplifies data integration from various sources.
Limitations:
- Dataflows are not designed to replace a data warehouse.
- They do not support row-level security.
- A Fabric capacity workspace is required to utilize them.
Dataflow can be utilized within the Data Factory workload, Power BI workspace, or directly in the lakehouse. This tool is particularly beneficial for data ingestion scenarios.
Key Features of Dataflows (Gen2):
-
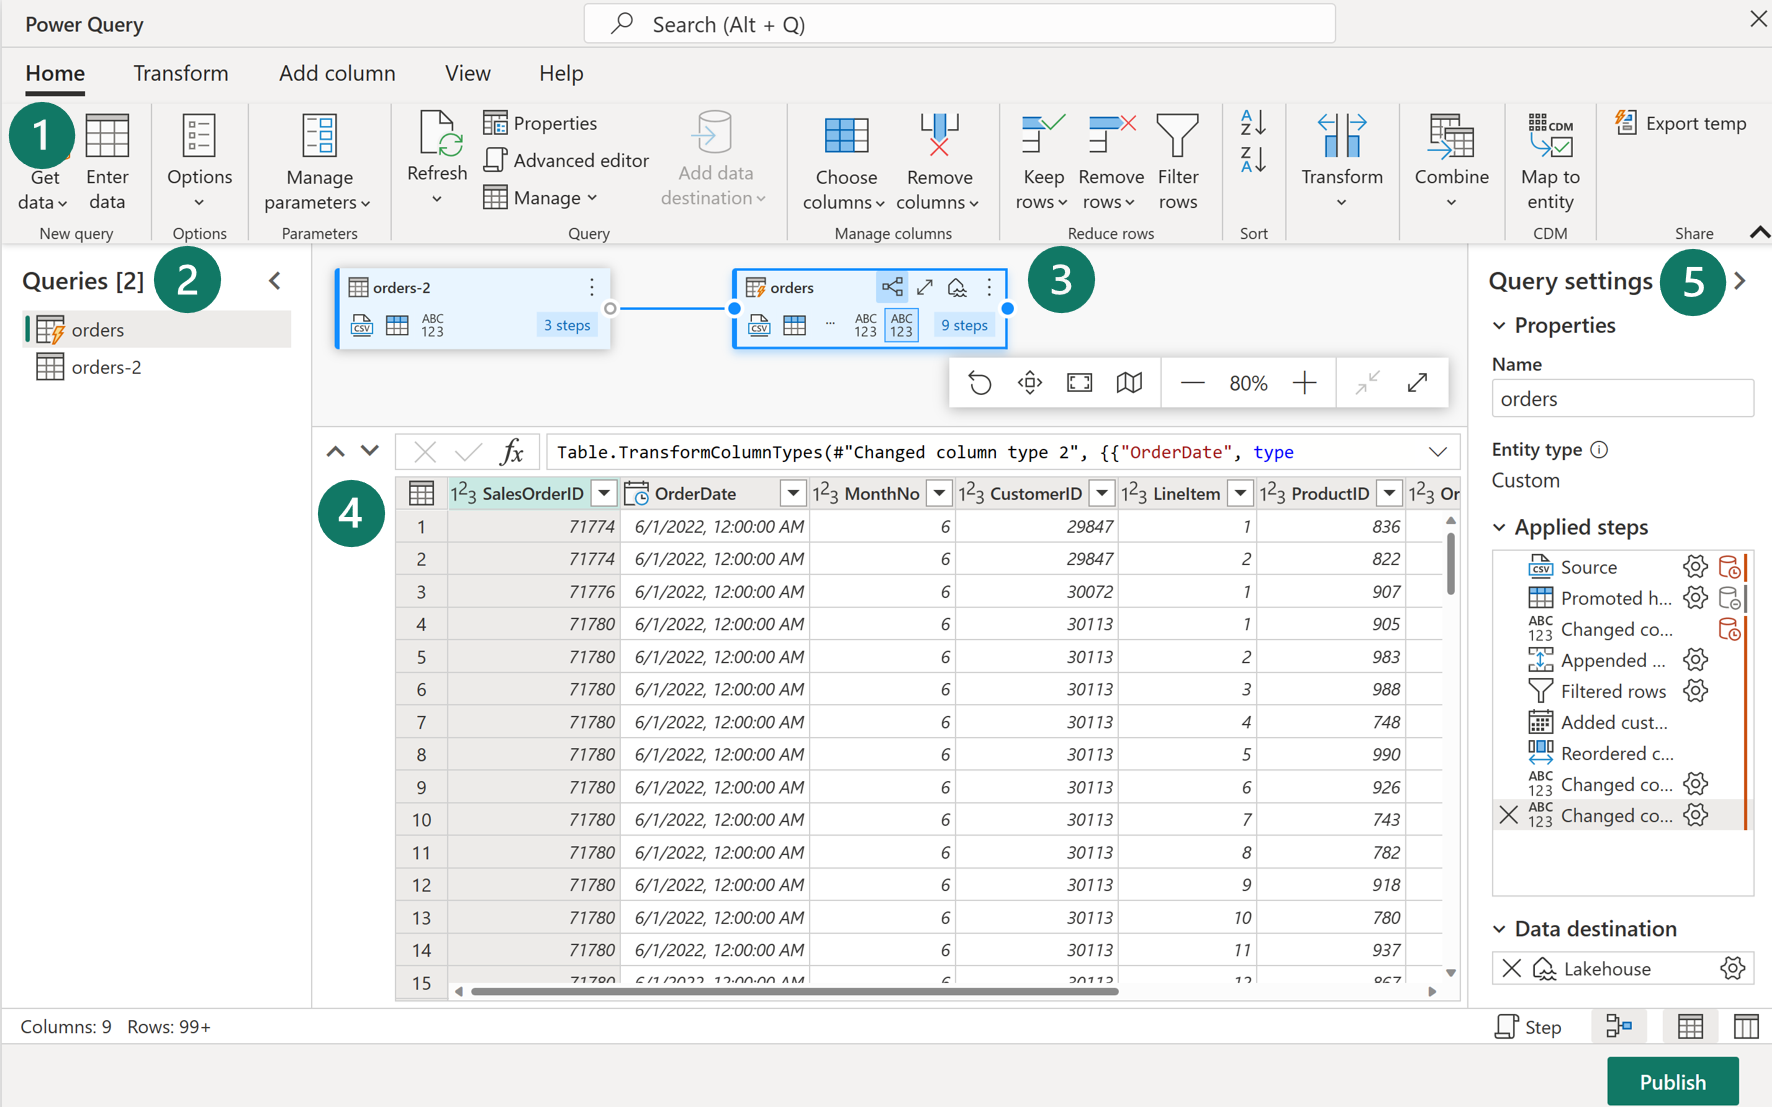
Power Query ribbon:
- Data Source Connectors: Supports a wide array from cloud and on-premises databases to Excel files, SharePoint, Salesforce, Spark, and Fabric Lakehouses.
- Data Transformations: Includes filtering, sorting, pivoting, merging, splitting, replacing values, and managing columns. Additional features like ranking, percentage calculations, and top/bottom N selections are also available.
-
Queries Pane:
- This pane displays various data sources, now termed as queries. It allows for renaming, duplicating, referencing, and enabling staging for these queries.
-
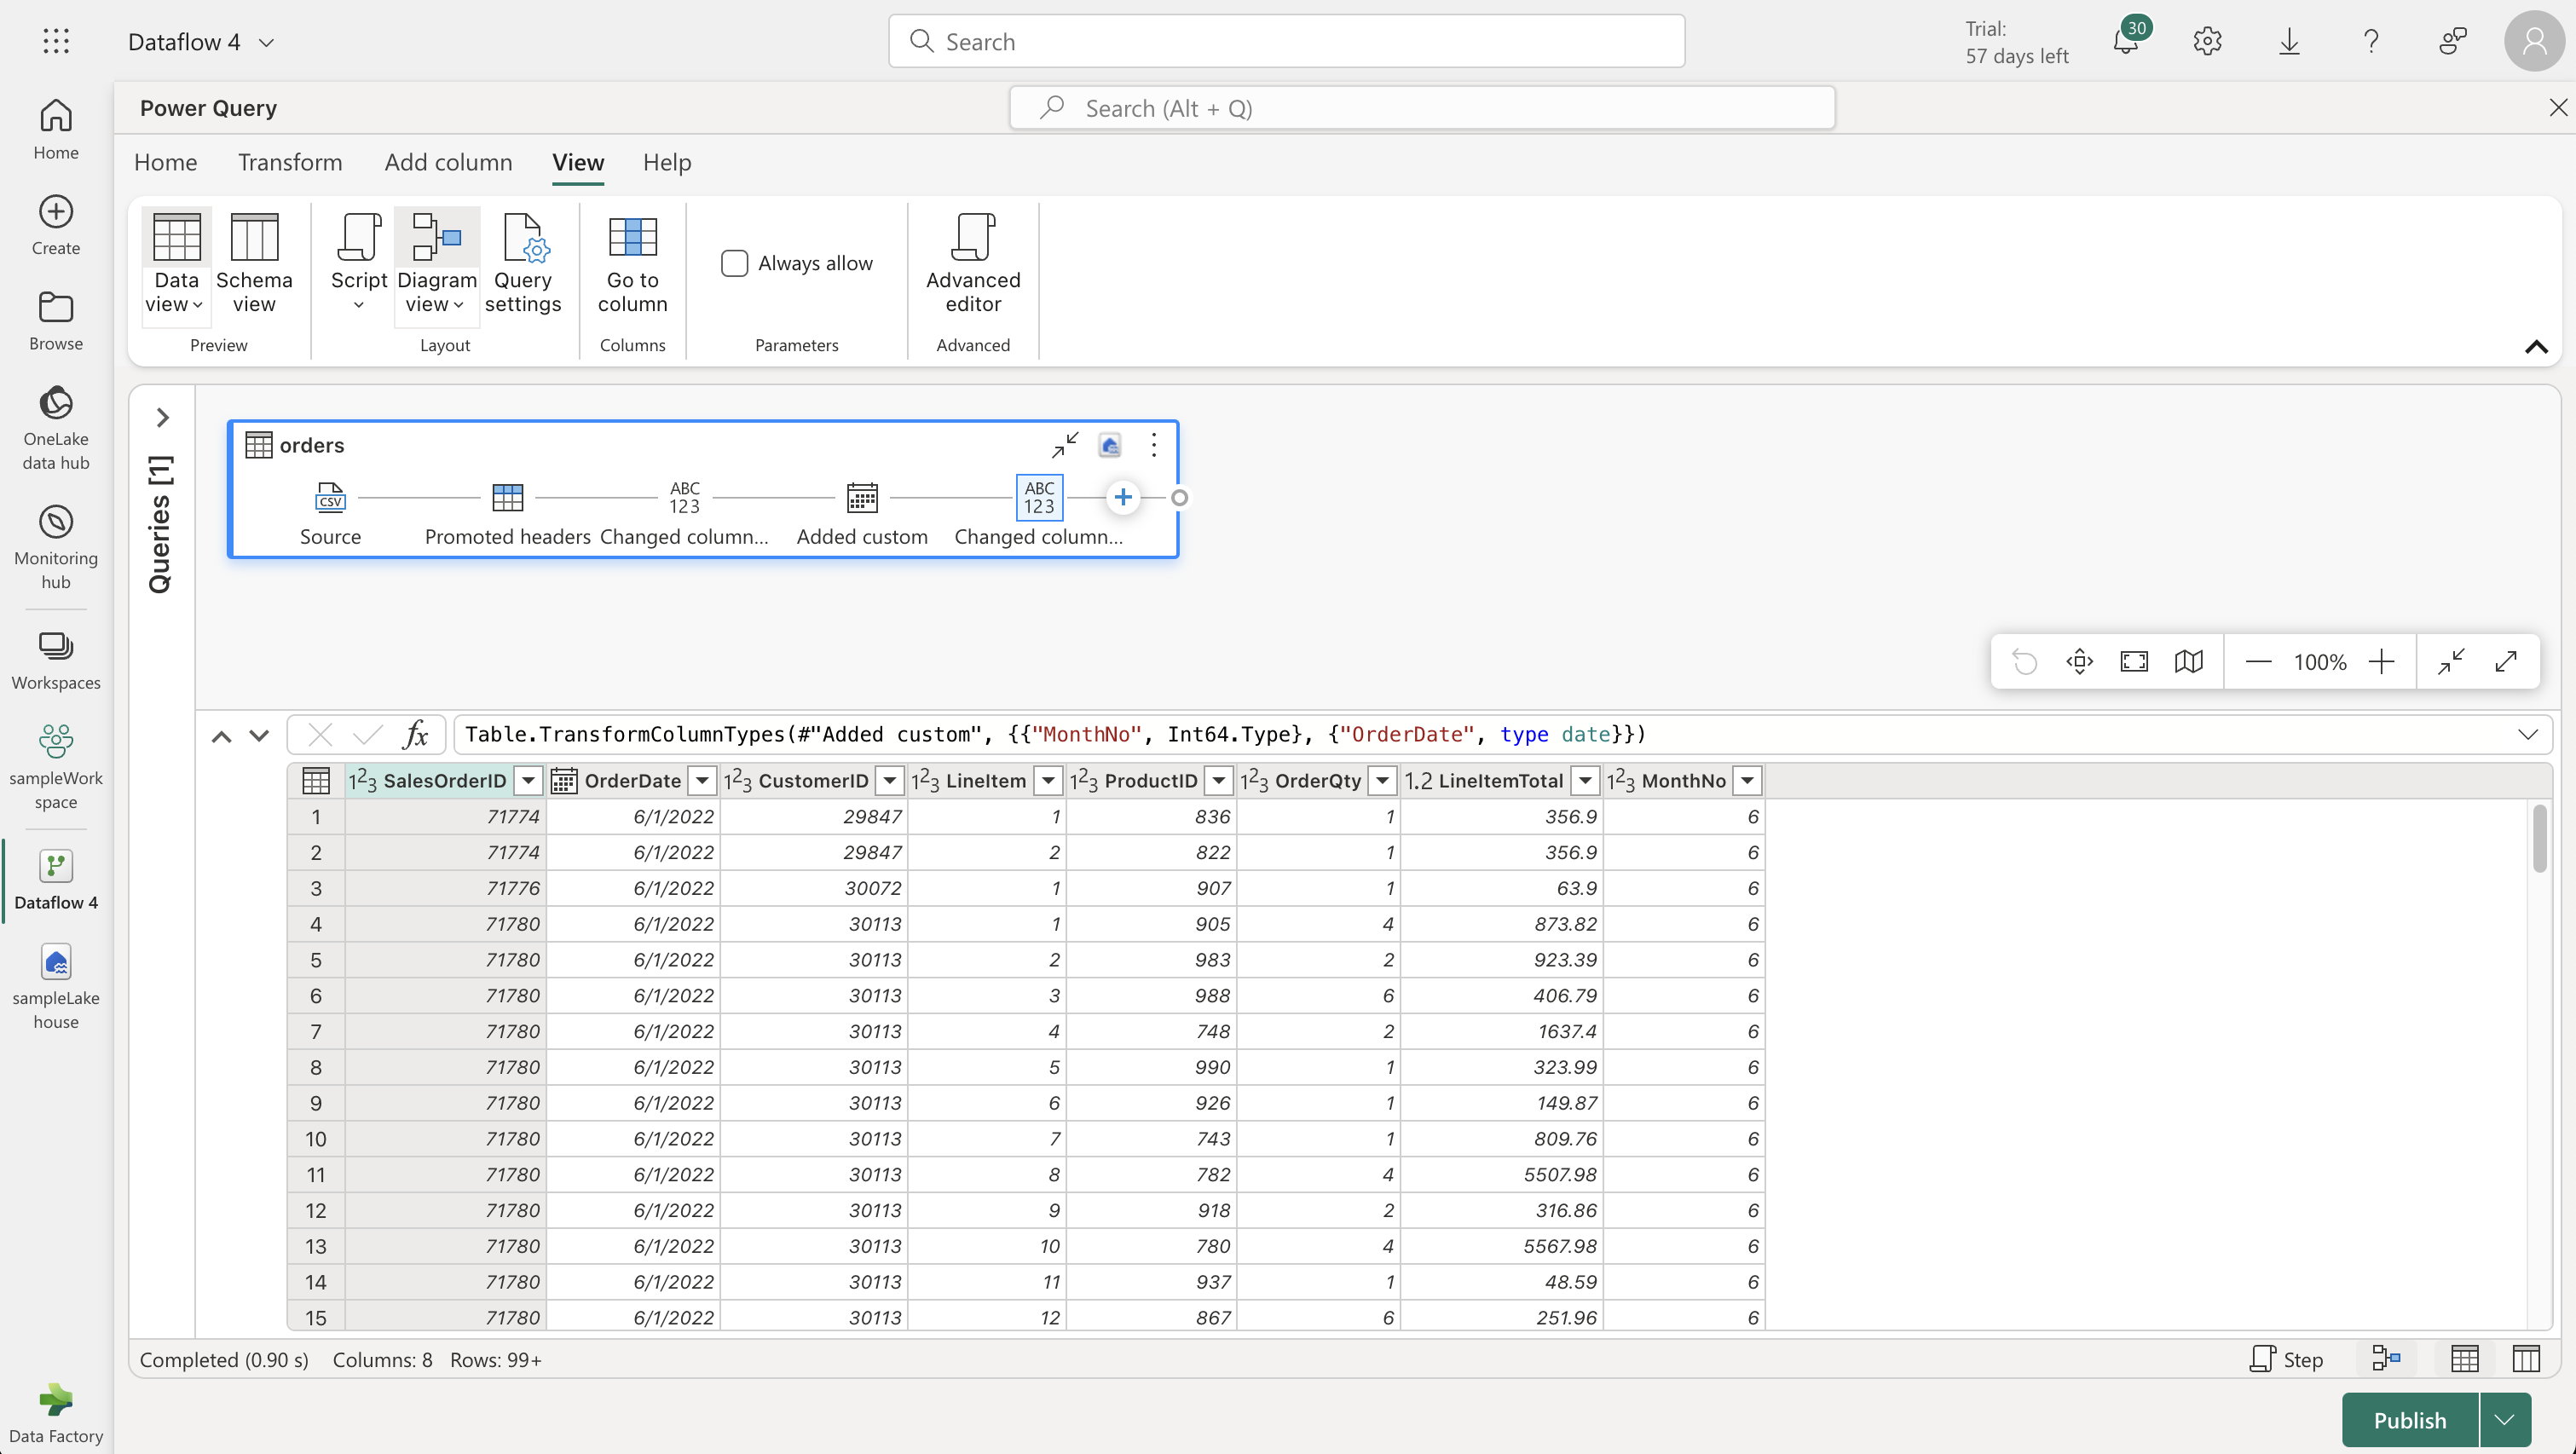
Diagram View:
- Offers a visual representation of the connections between data sources and the transformations applied.
-
Data Preview Pane:
- Provides a glimpse of a data subset, helping in determining the necessary transformations. It allows interactive features like dragging columns for reordering or right-clicking for filtering.
-
Query Settings Pane:
- Here, each transformation step is listed. The complexity of your transformations can be observed through the number of applied steps. This pane also allows setting the Lakehouse as the data destination.
How to Use Dataflows (Gen2):
-
Creating a Workspace:
- Go to Microsoft Fabric’s homepage and select “Synapse Data Engineering”.
- Click on “Workspaces” (🗇 icon) and create a new workspace.
- Choose a licensing mode with Fabric capacity (Trial, Premium, or Fabric).
- Upon opening your workspace, it will initially be empty.
-
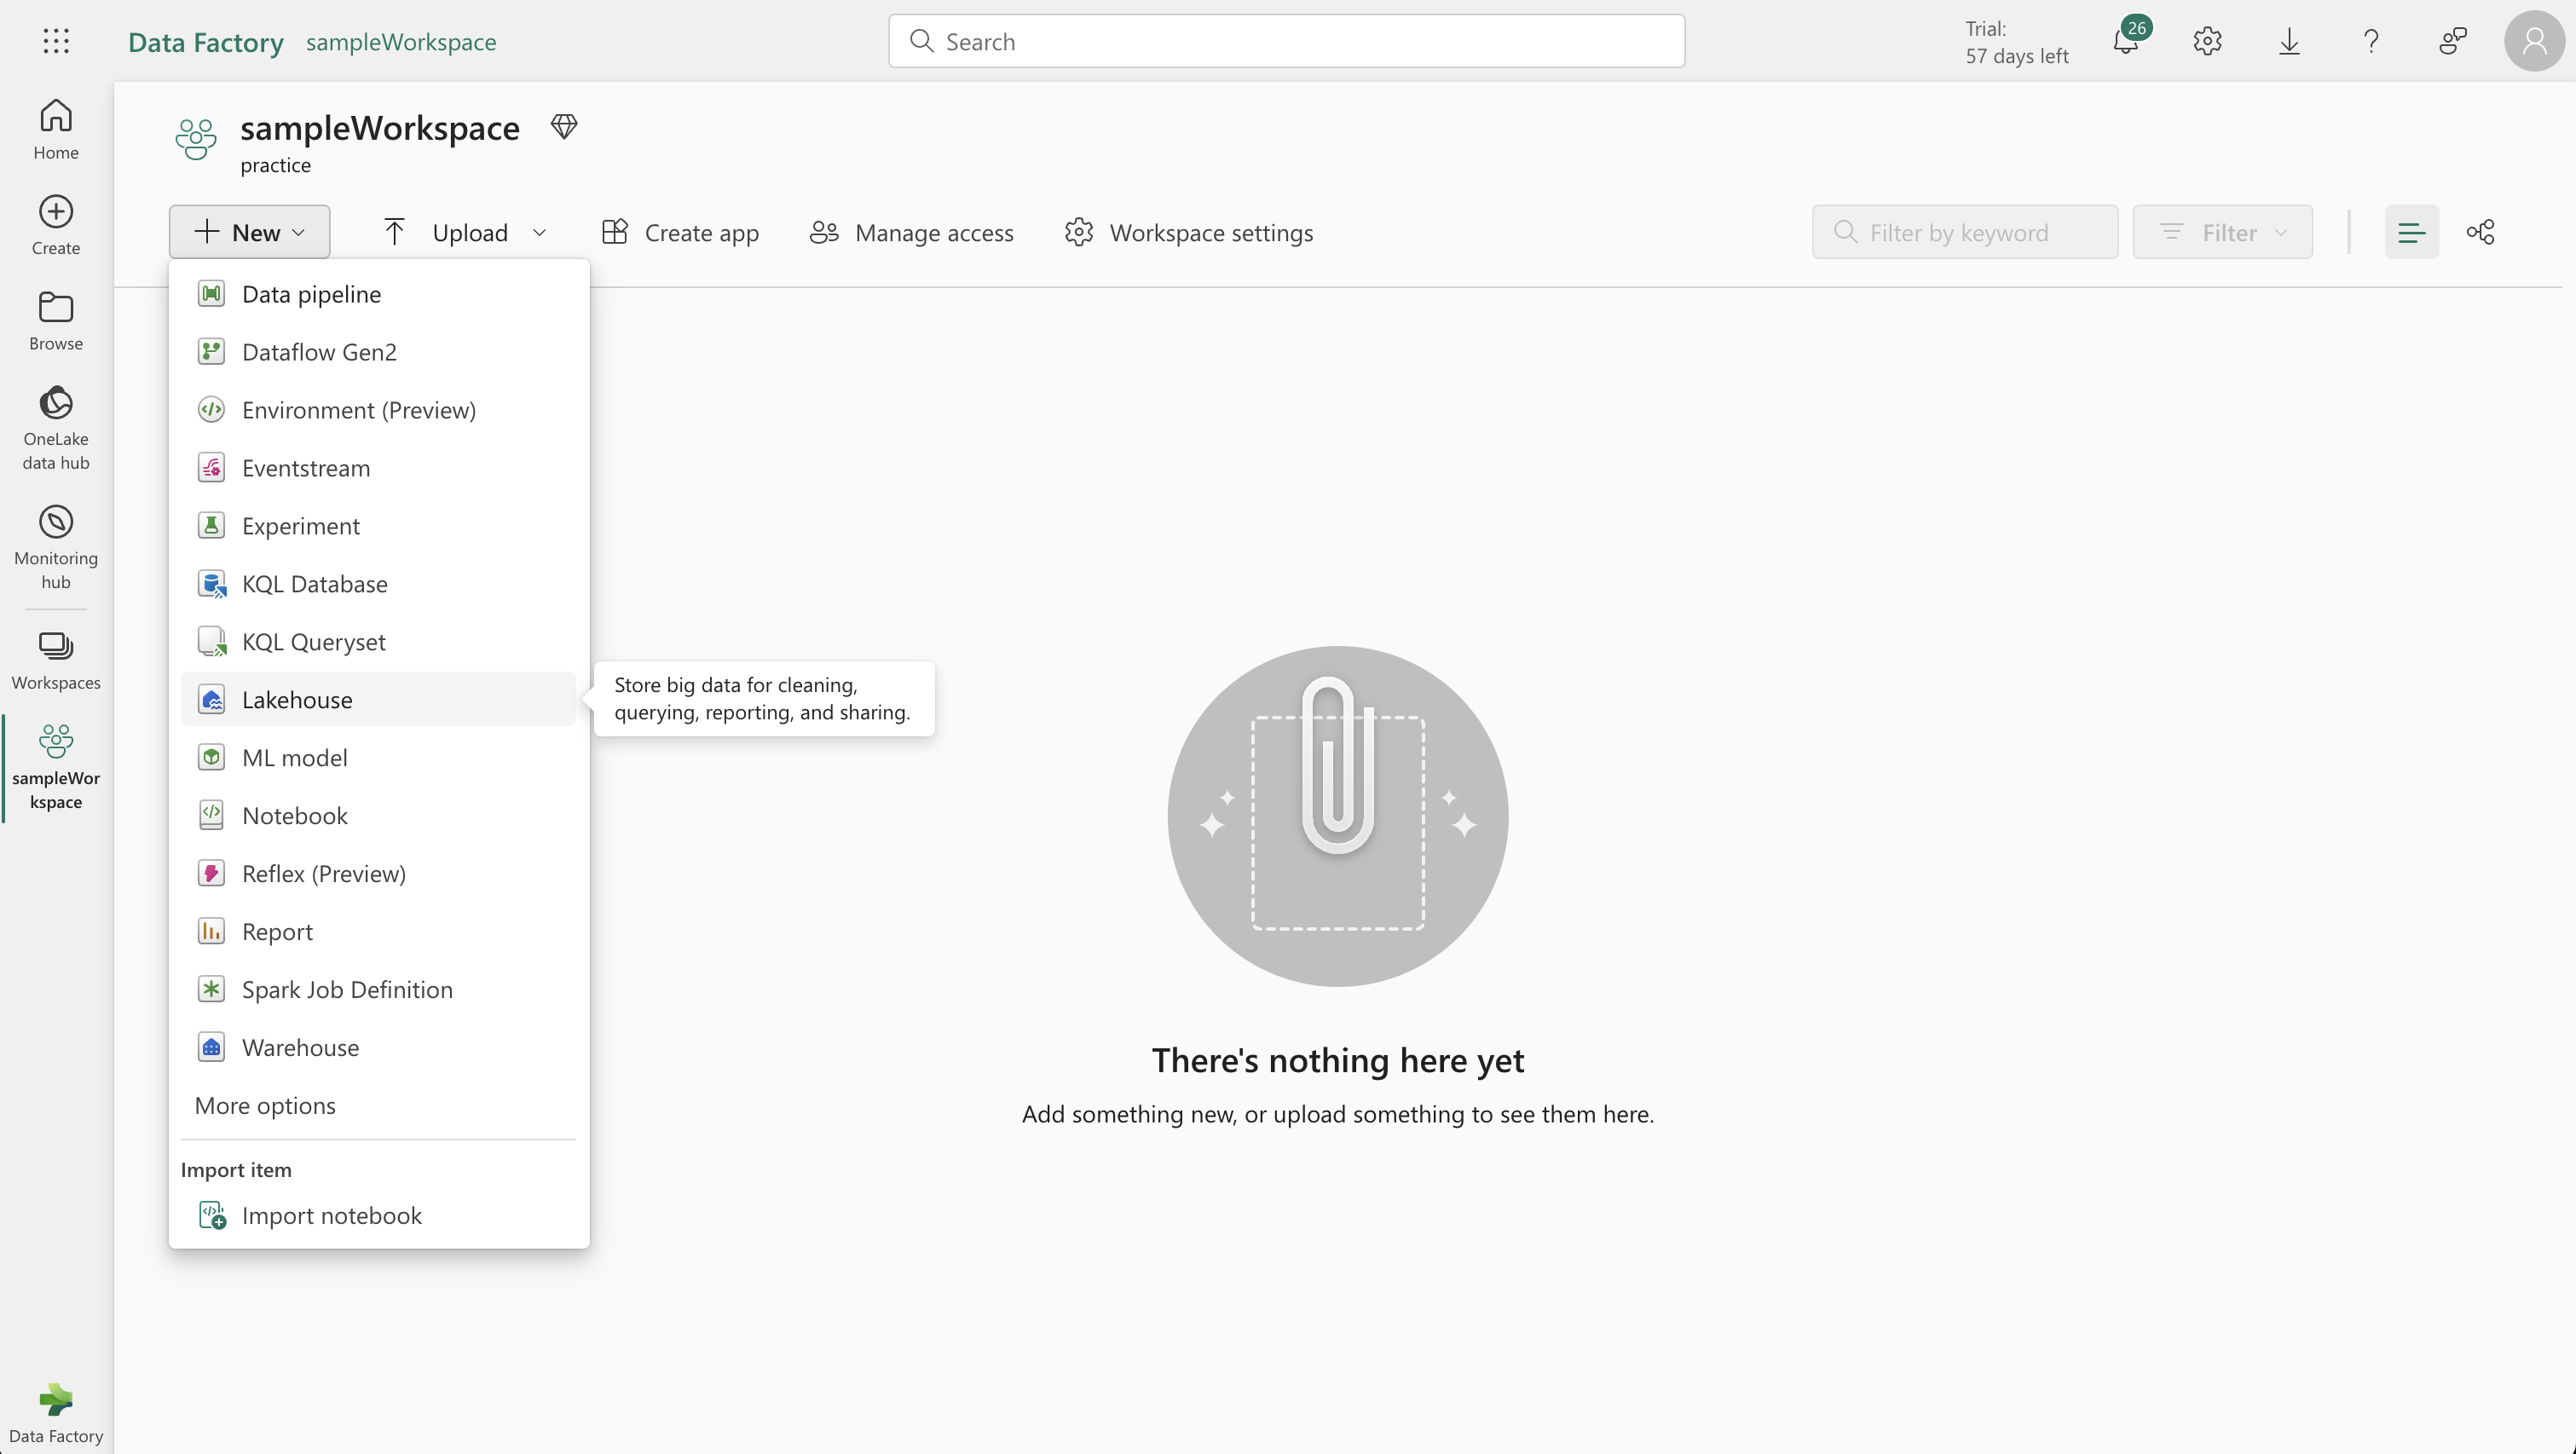
Creating a Lakehouse:
- In your new workspace, create a “Lakehouse”.
- Name the Lakehouse as per your preference.
- It will be ready in about a minute and start as an empty lakehouse.
-
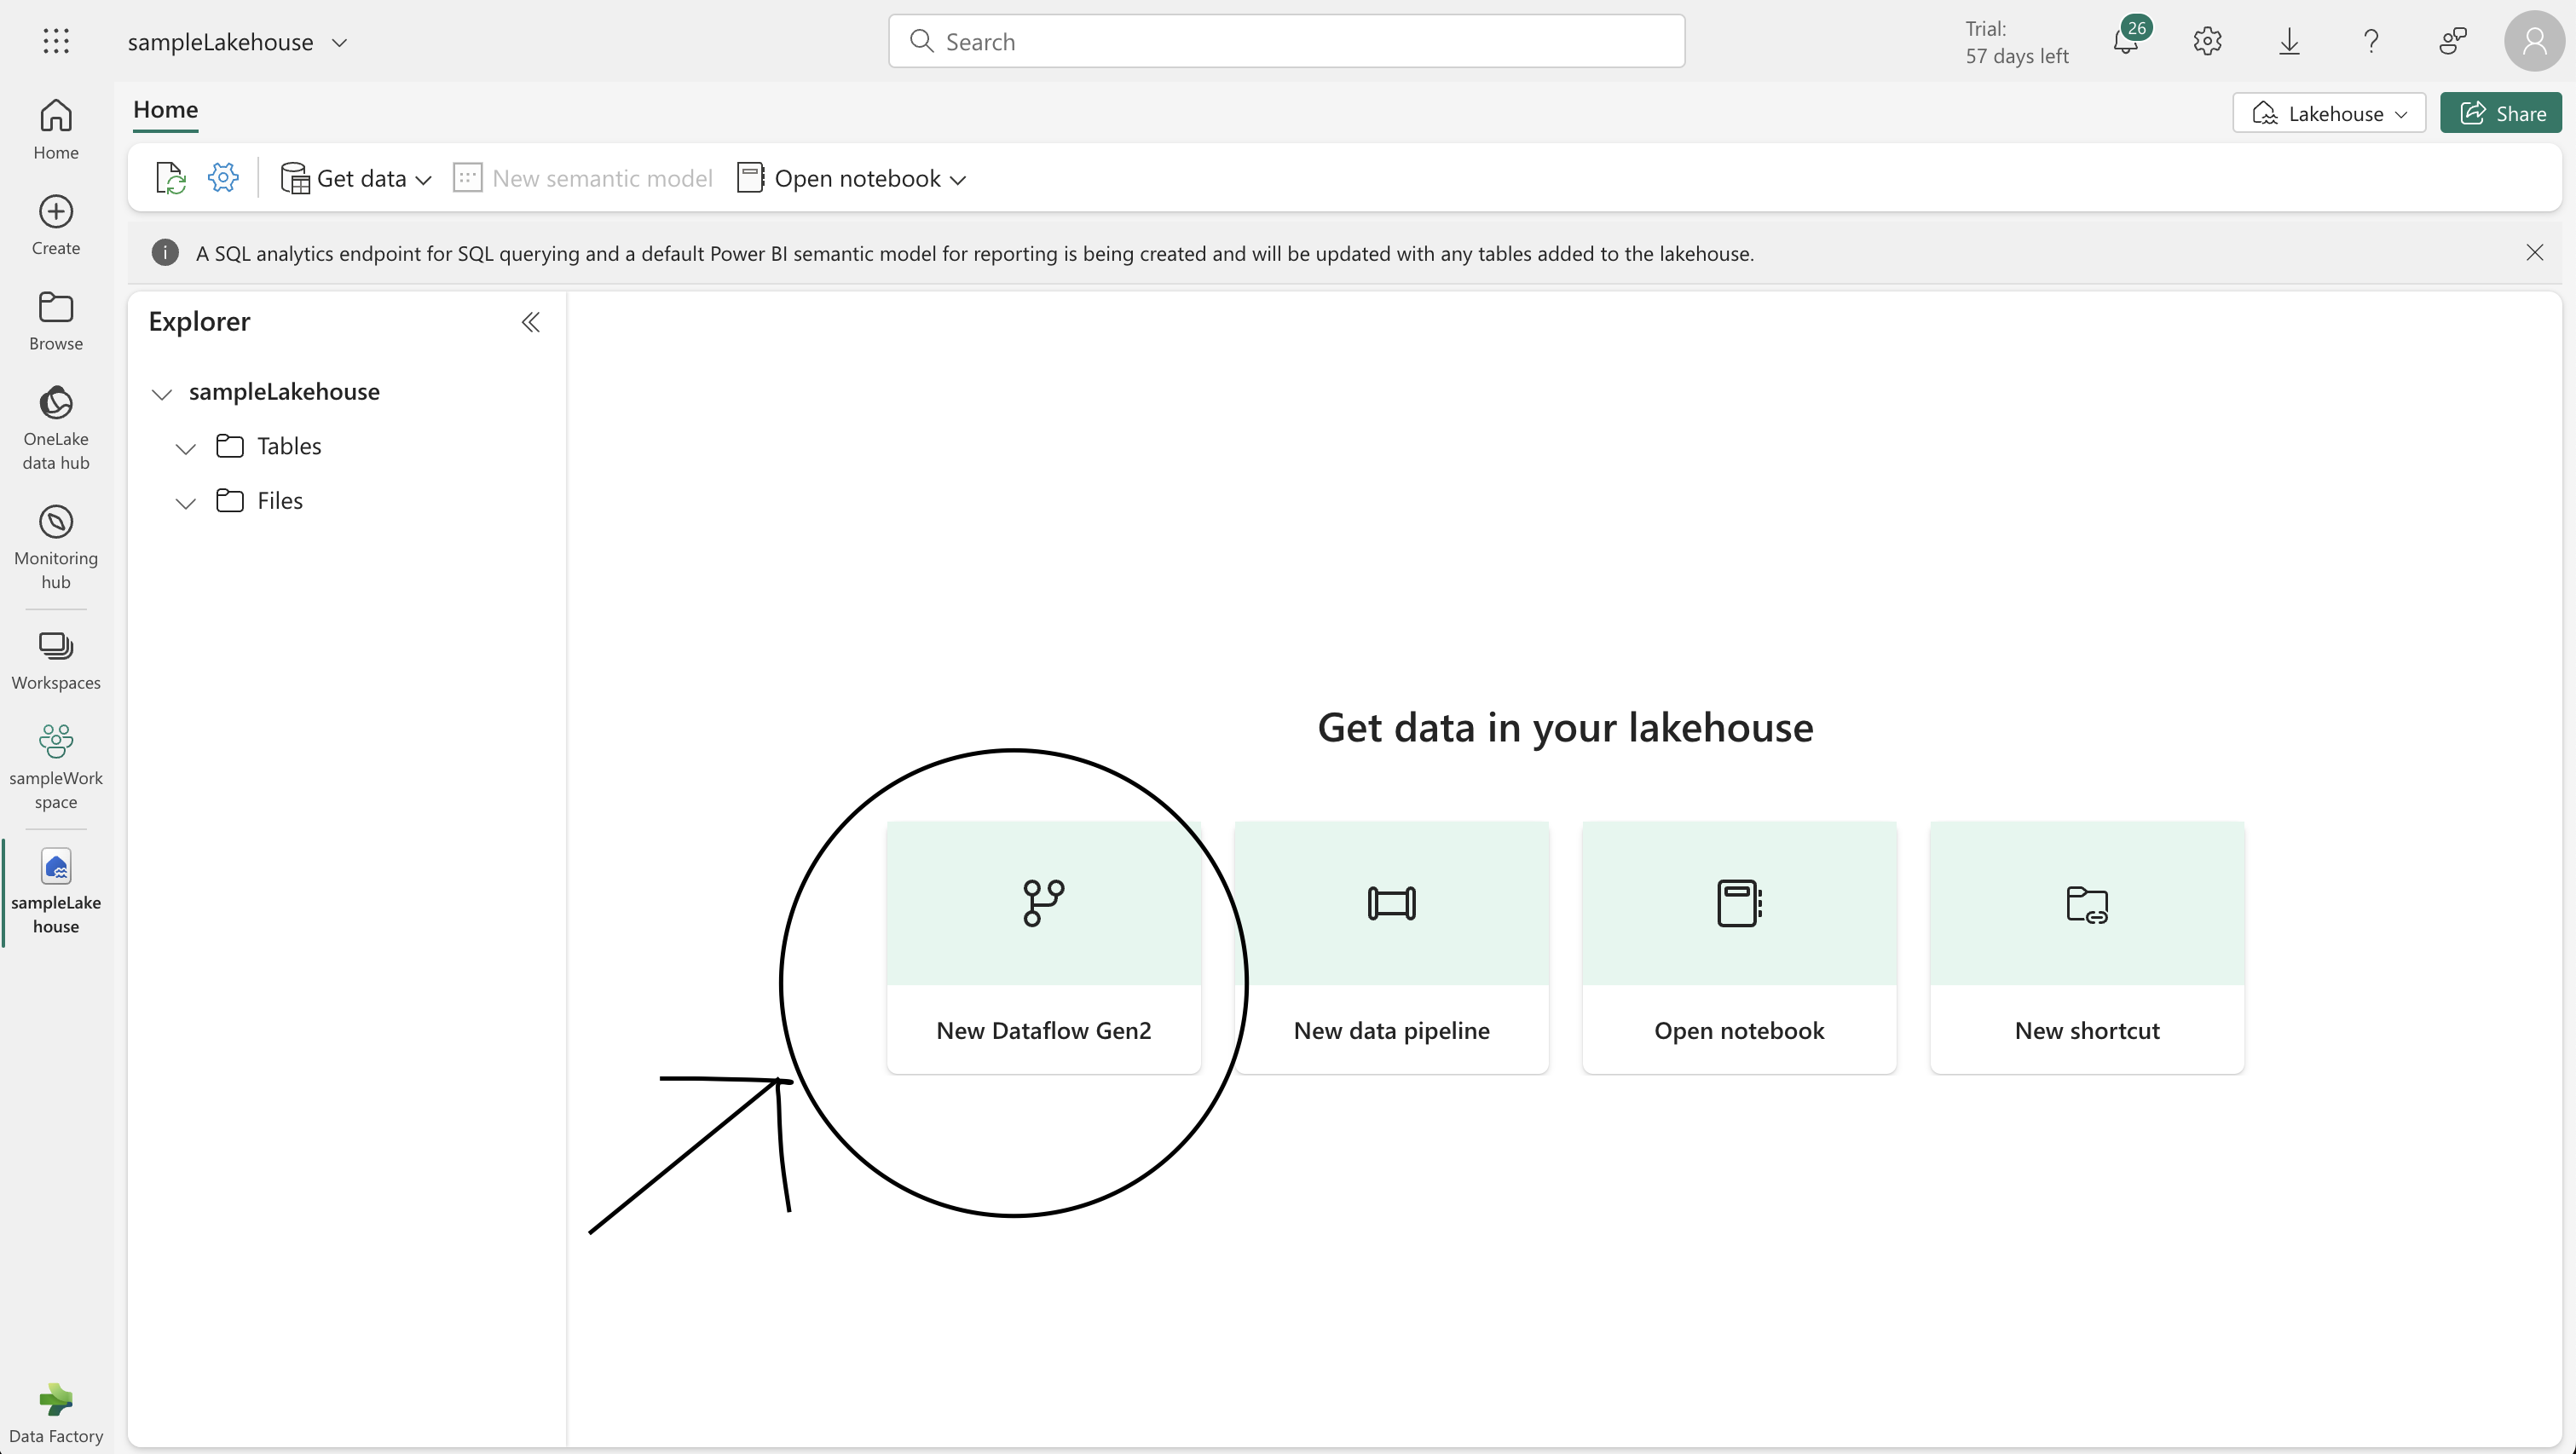
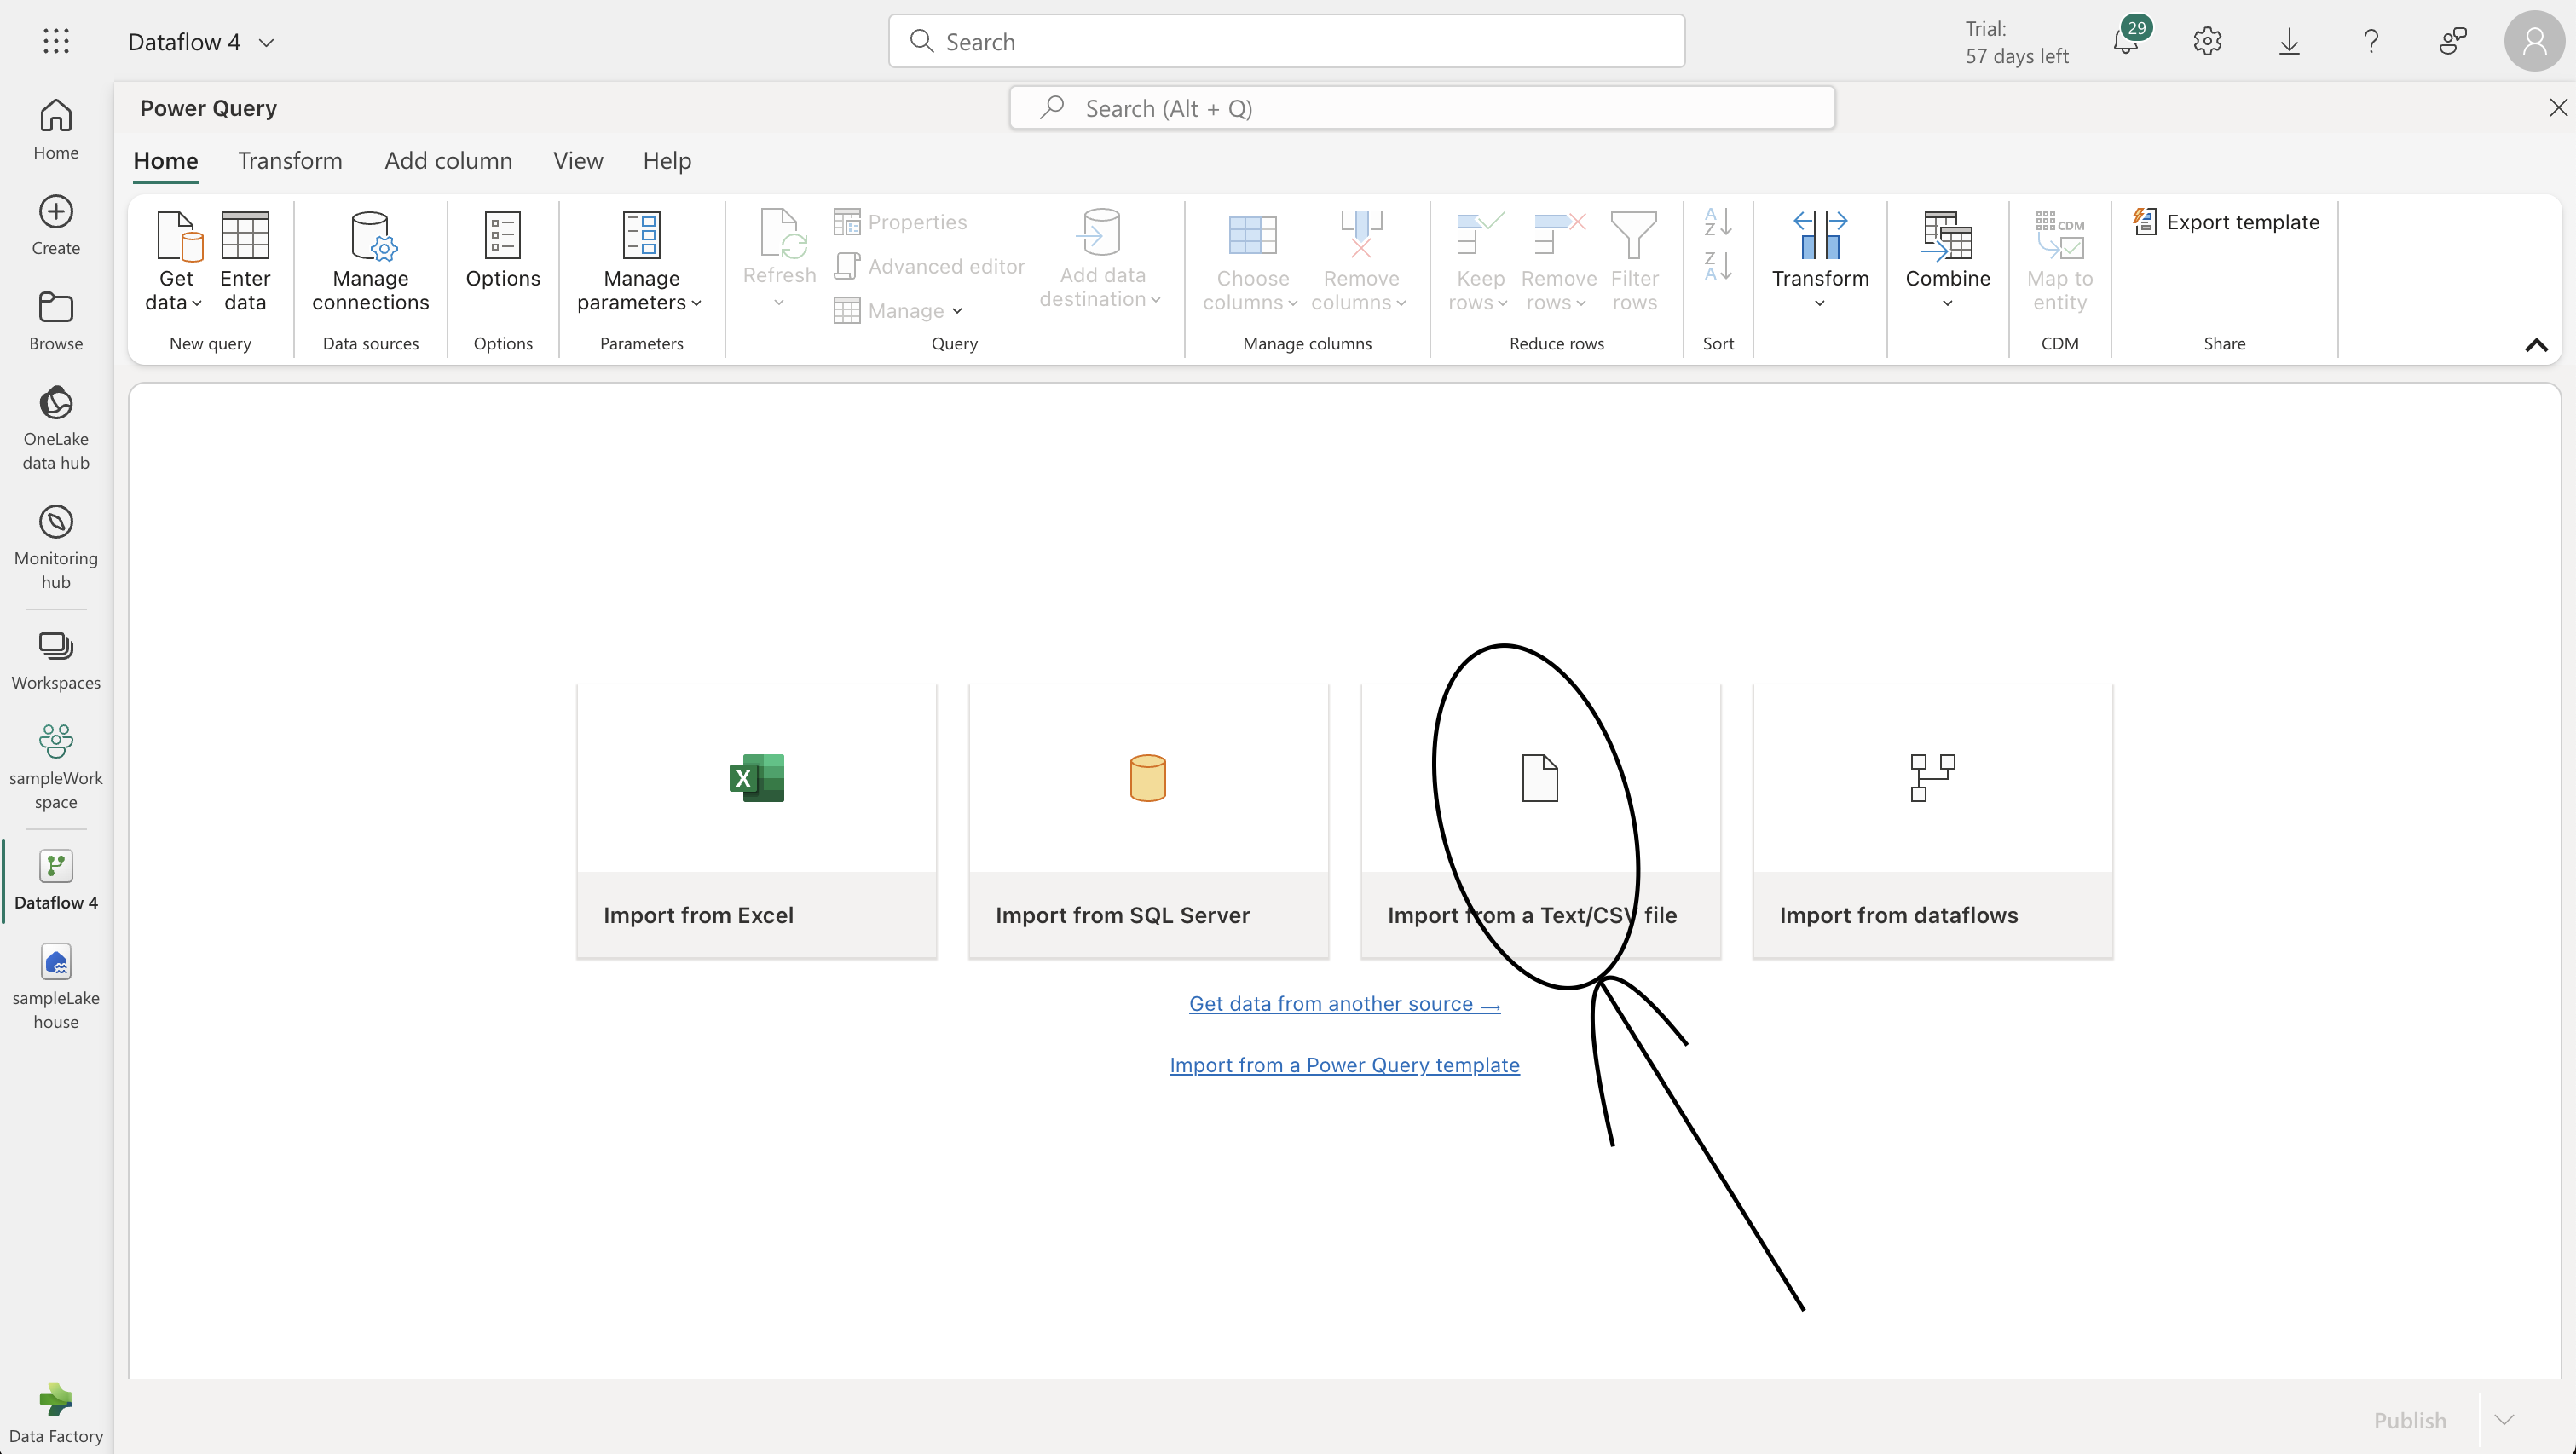
Creating a Dataflow for Data Ingestion:
- Select “New Dataflow Gen2” in your workspace.
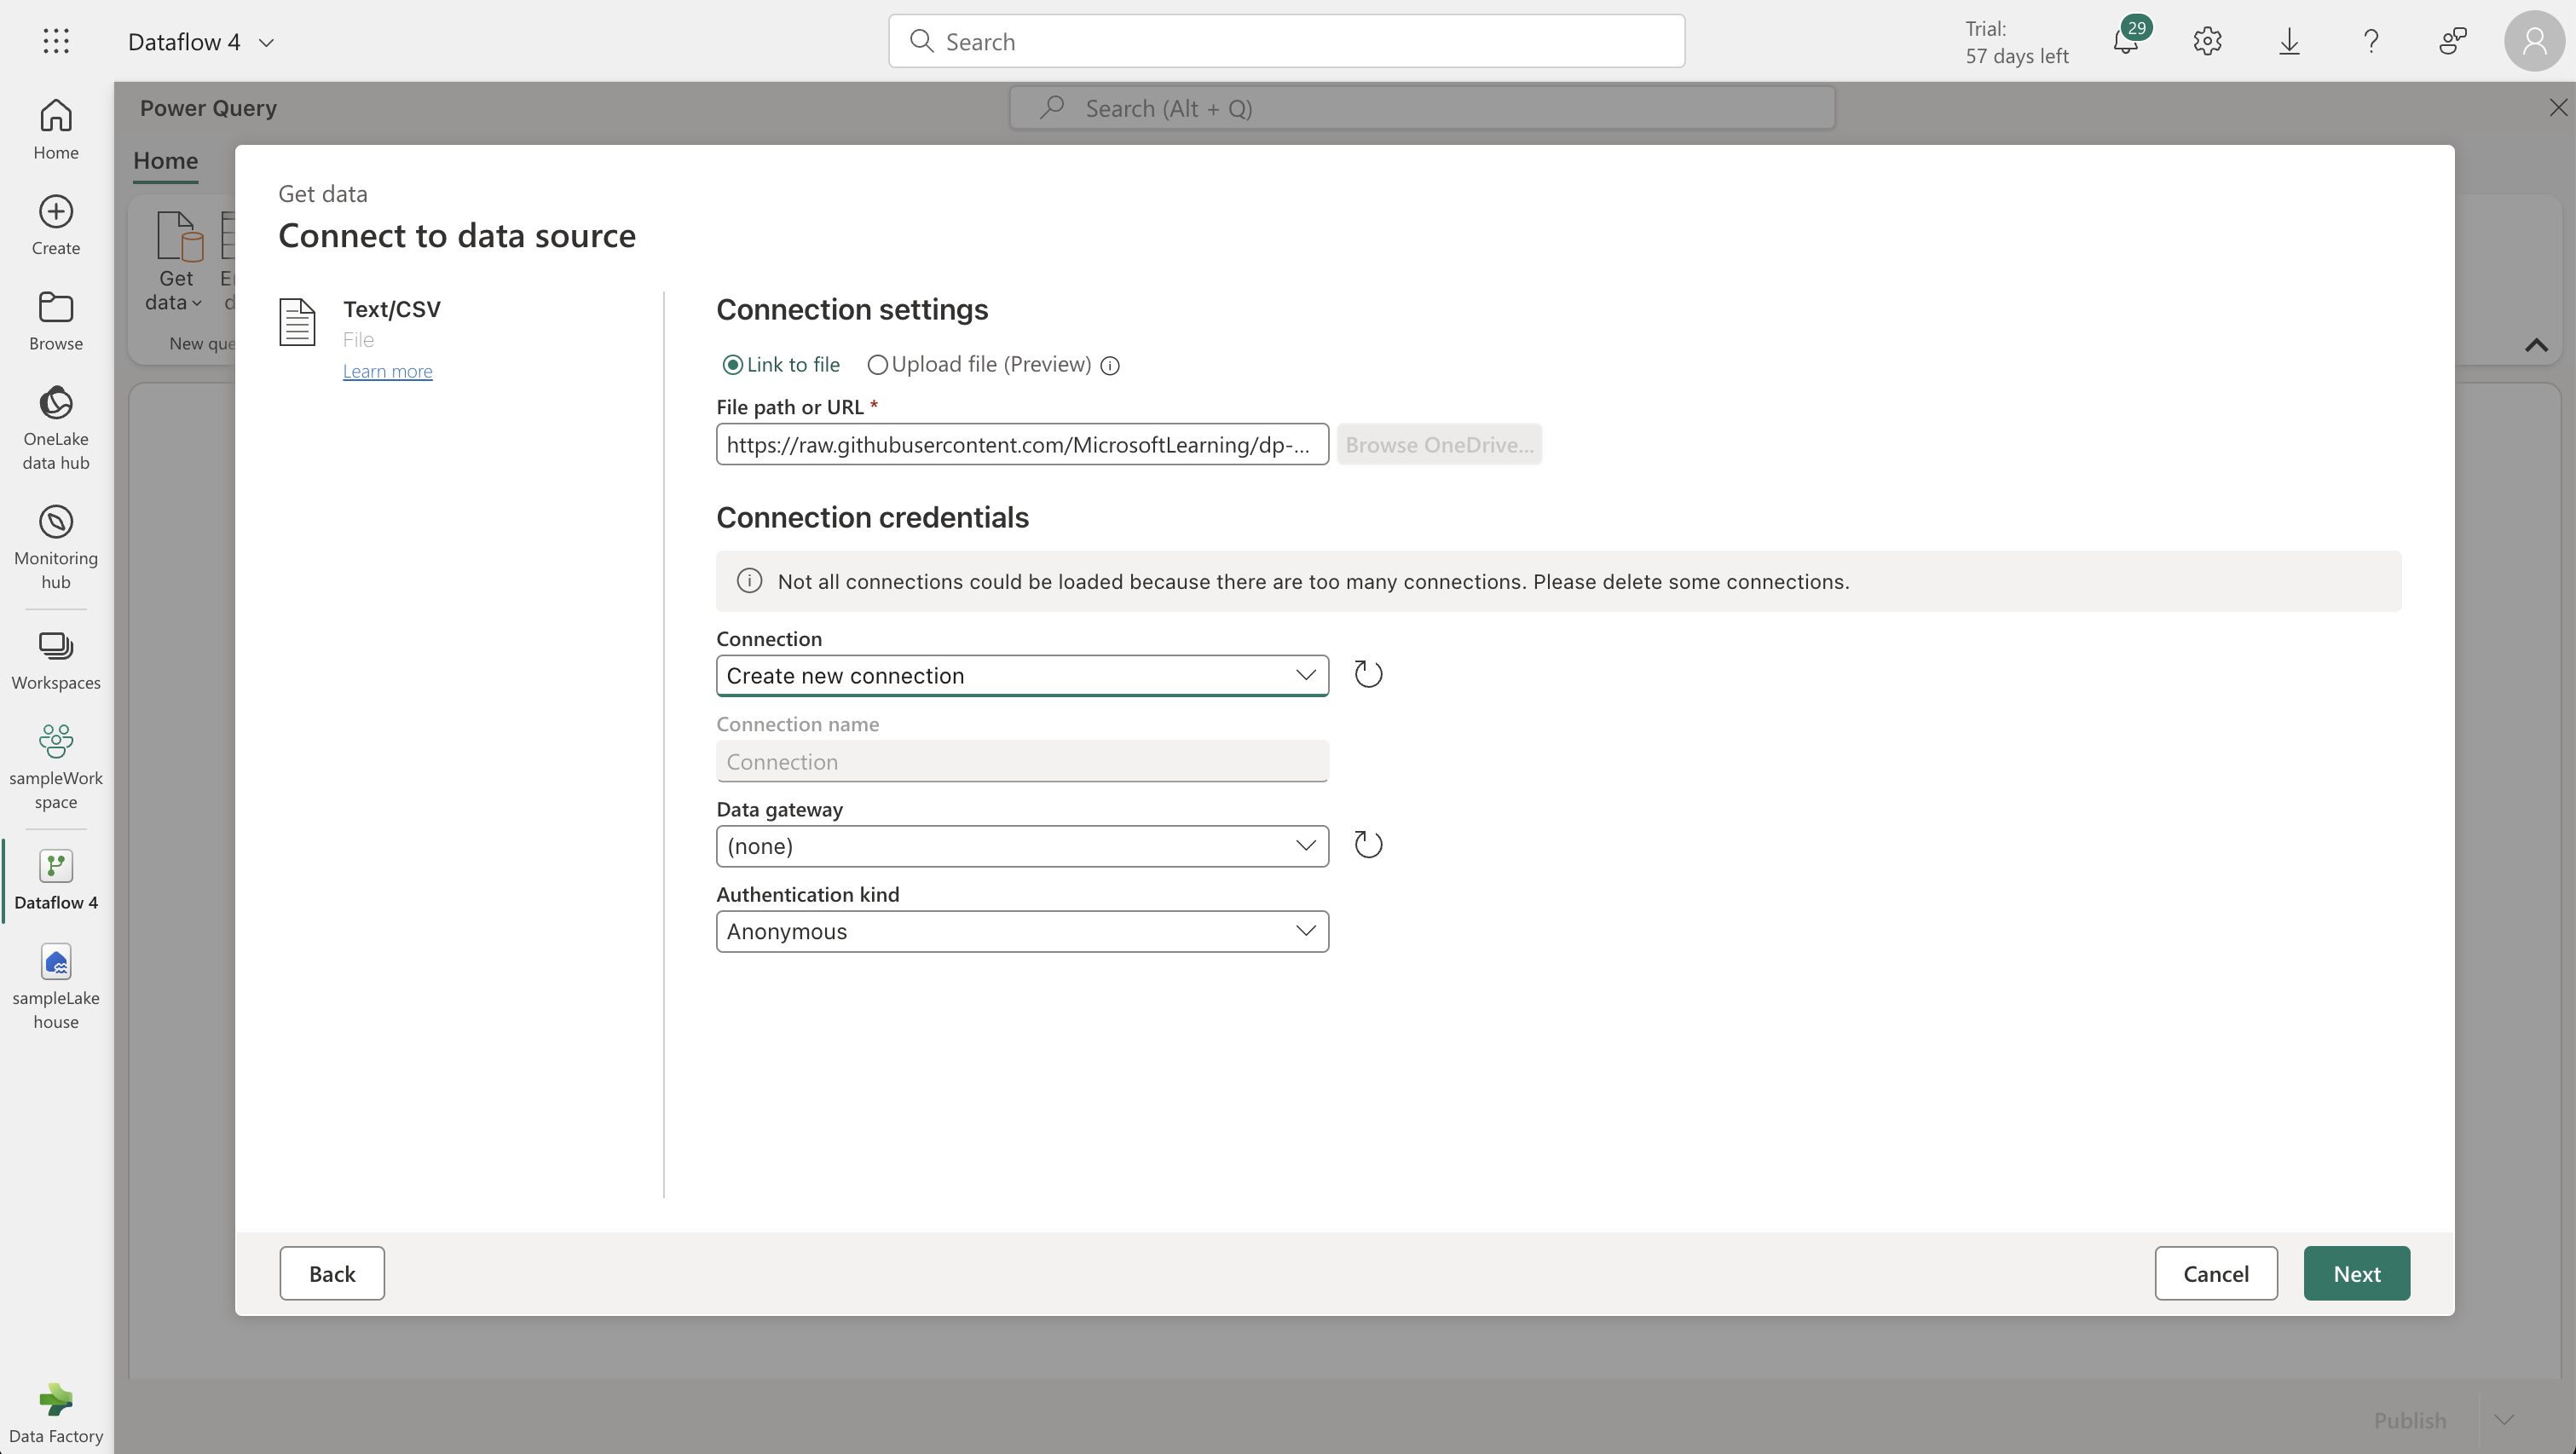
- Import data from a Text/CSV file. Use the following settings for data source:
- File path: [https://raw.githubusercontent.com/MicrosoftLearning/dp-data/main/orders.csv]
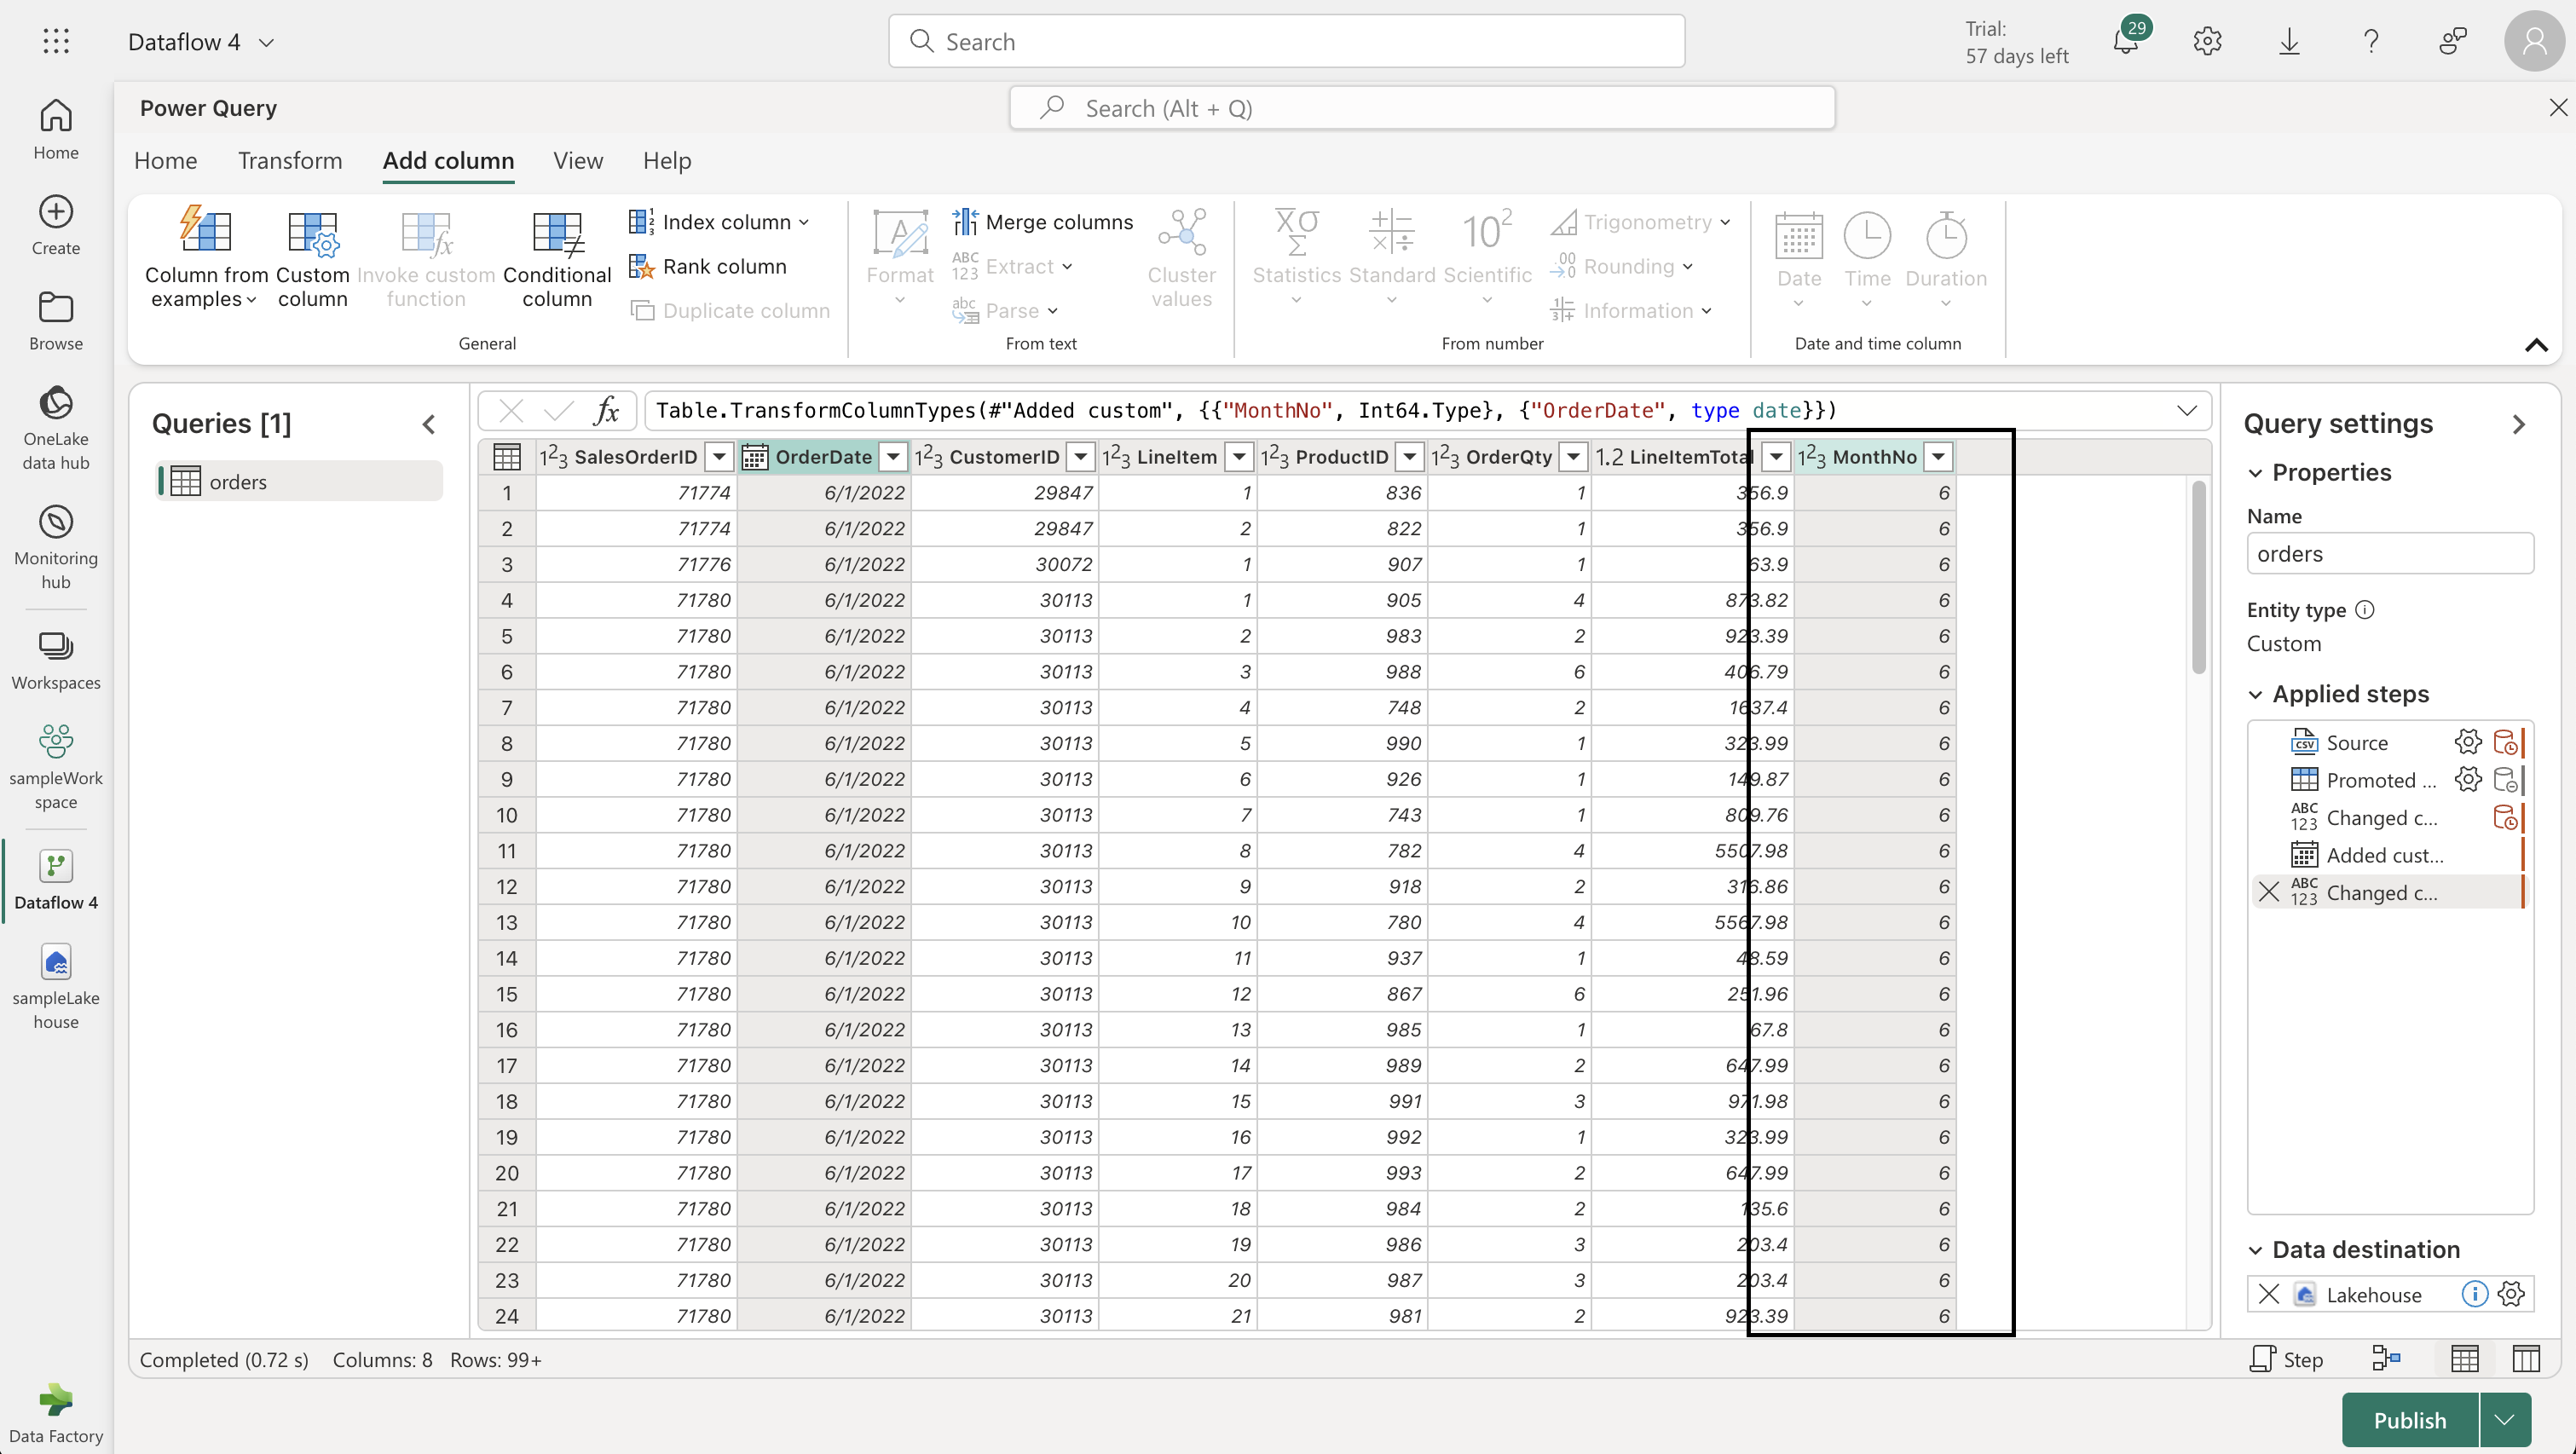
- Use the Power Query editor to format the data. Add a custom column named "MonthNo" with the formula: `Date.Month([OrderDate])`.

- Confirm data types for "OrderDate" (Date) and "MonthNo" (Whole Number).
-
Adding Data Destination:
- In the Power Query editor, choose “Lakehouse” as your data destination.
- Configure the connection with your Power BI organizational account.
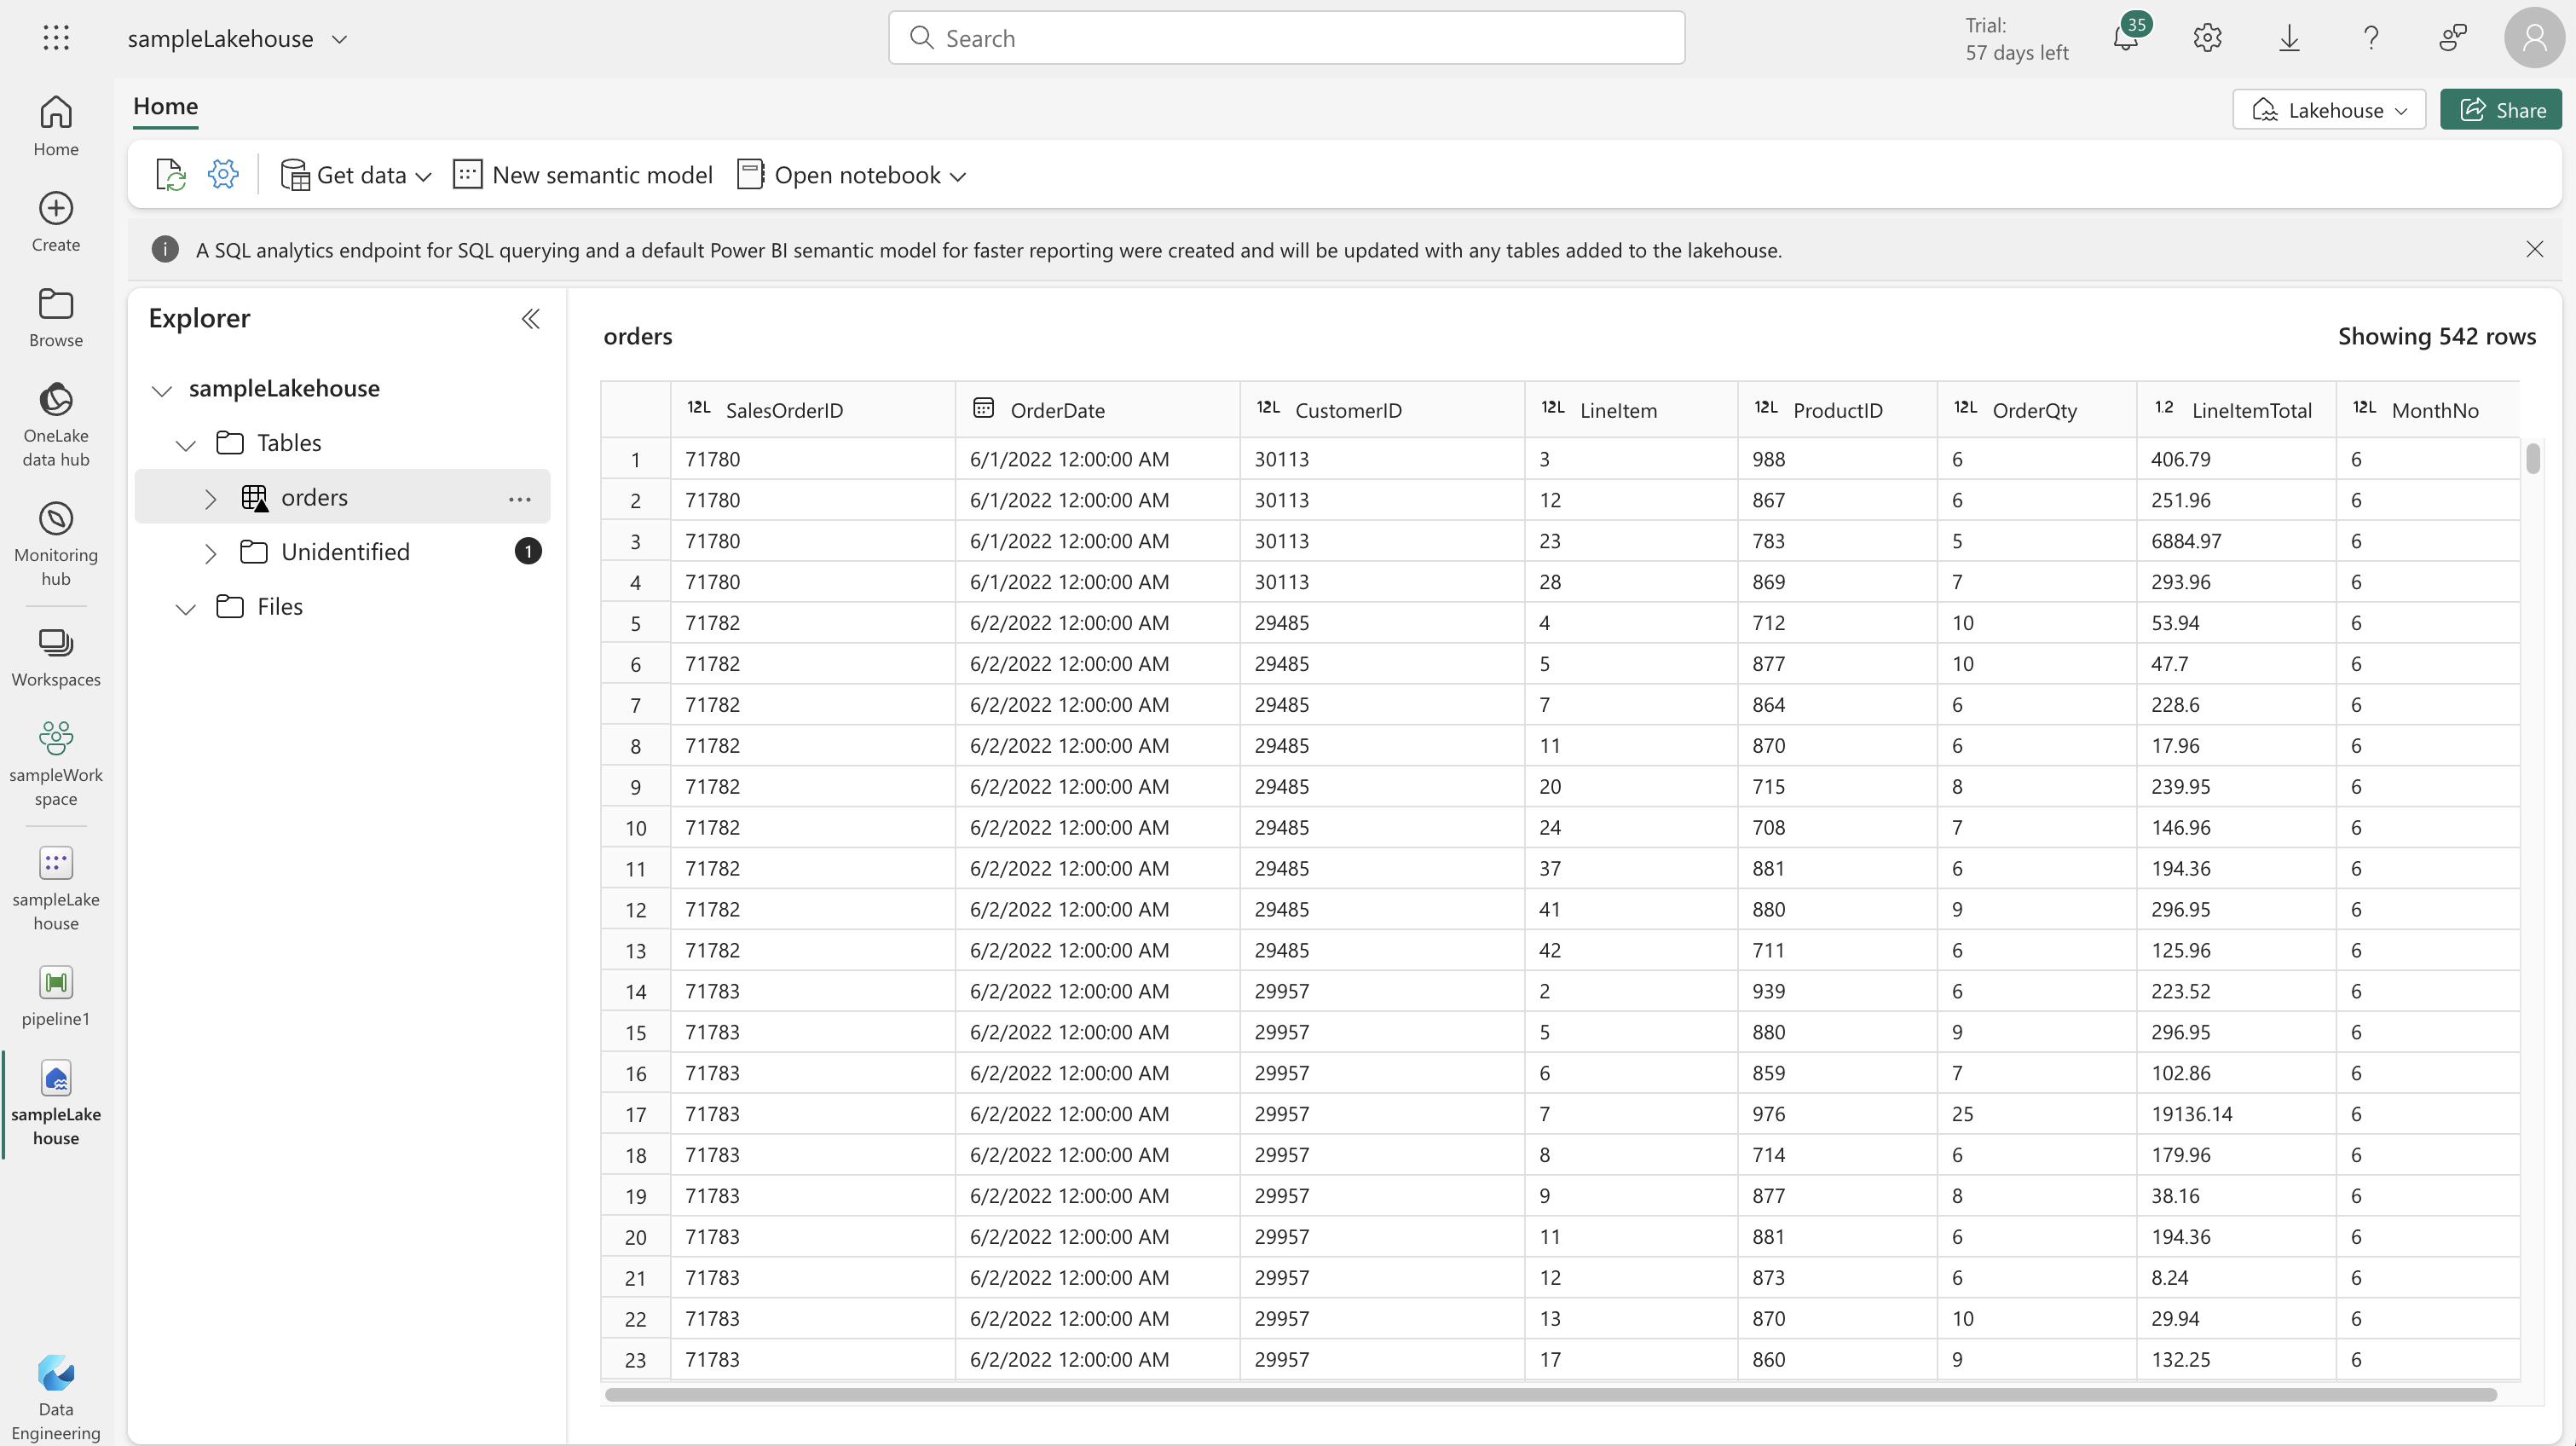
- Select your workspace and the created lakehouse, then specify a new table named “orders”.
- Choose “Append” for destination settings and save.
-
Publishing and Using the Dataflow:
- Publish the dataflow and rename it in your workspace if desired.
- Create a new pipeline in the Data Engineering experience and include the dataflow as an activity.
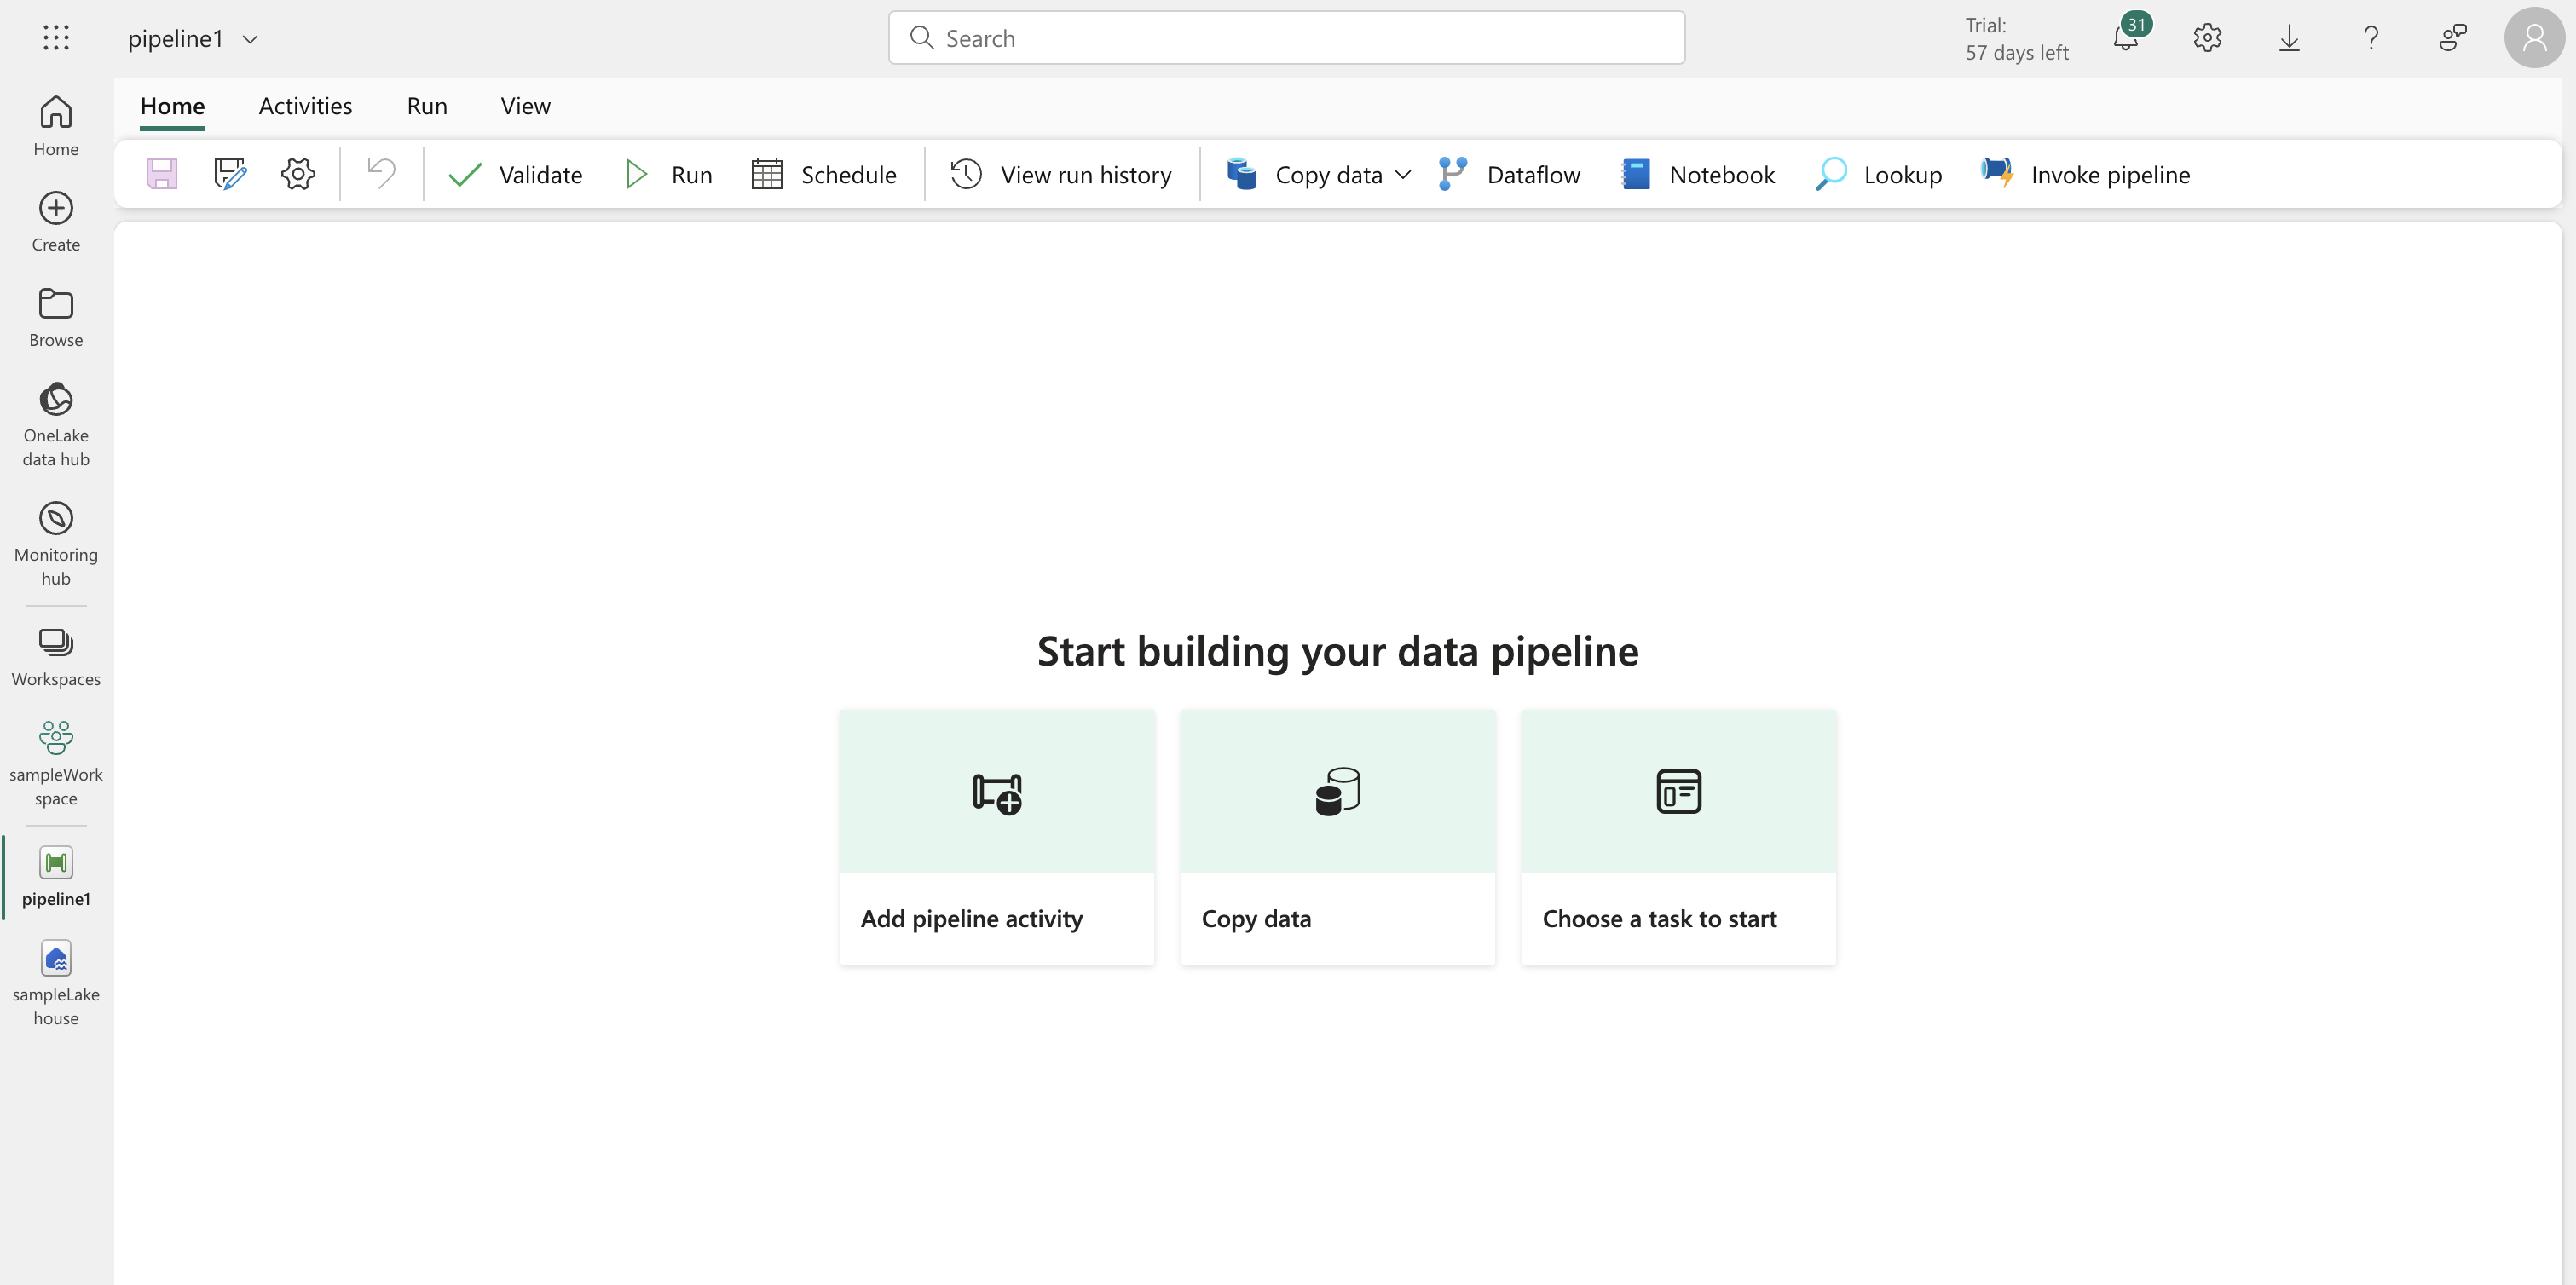
- Run the pipeline and wait for completion.
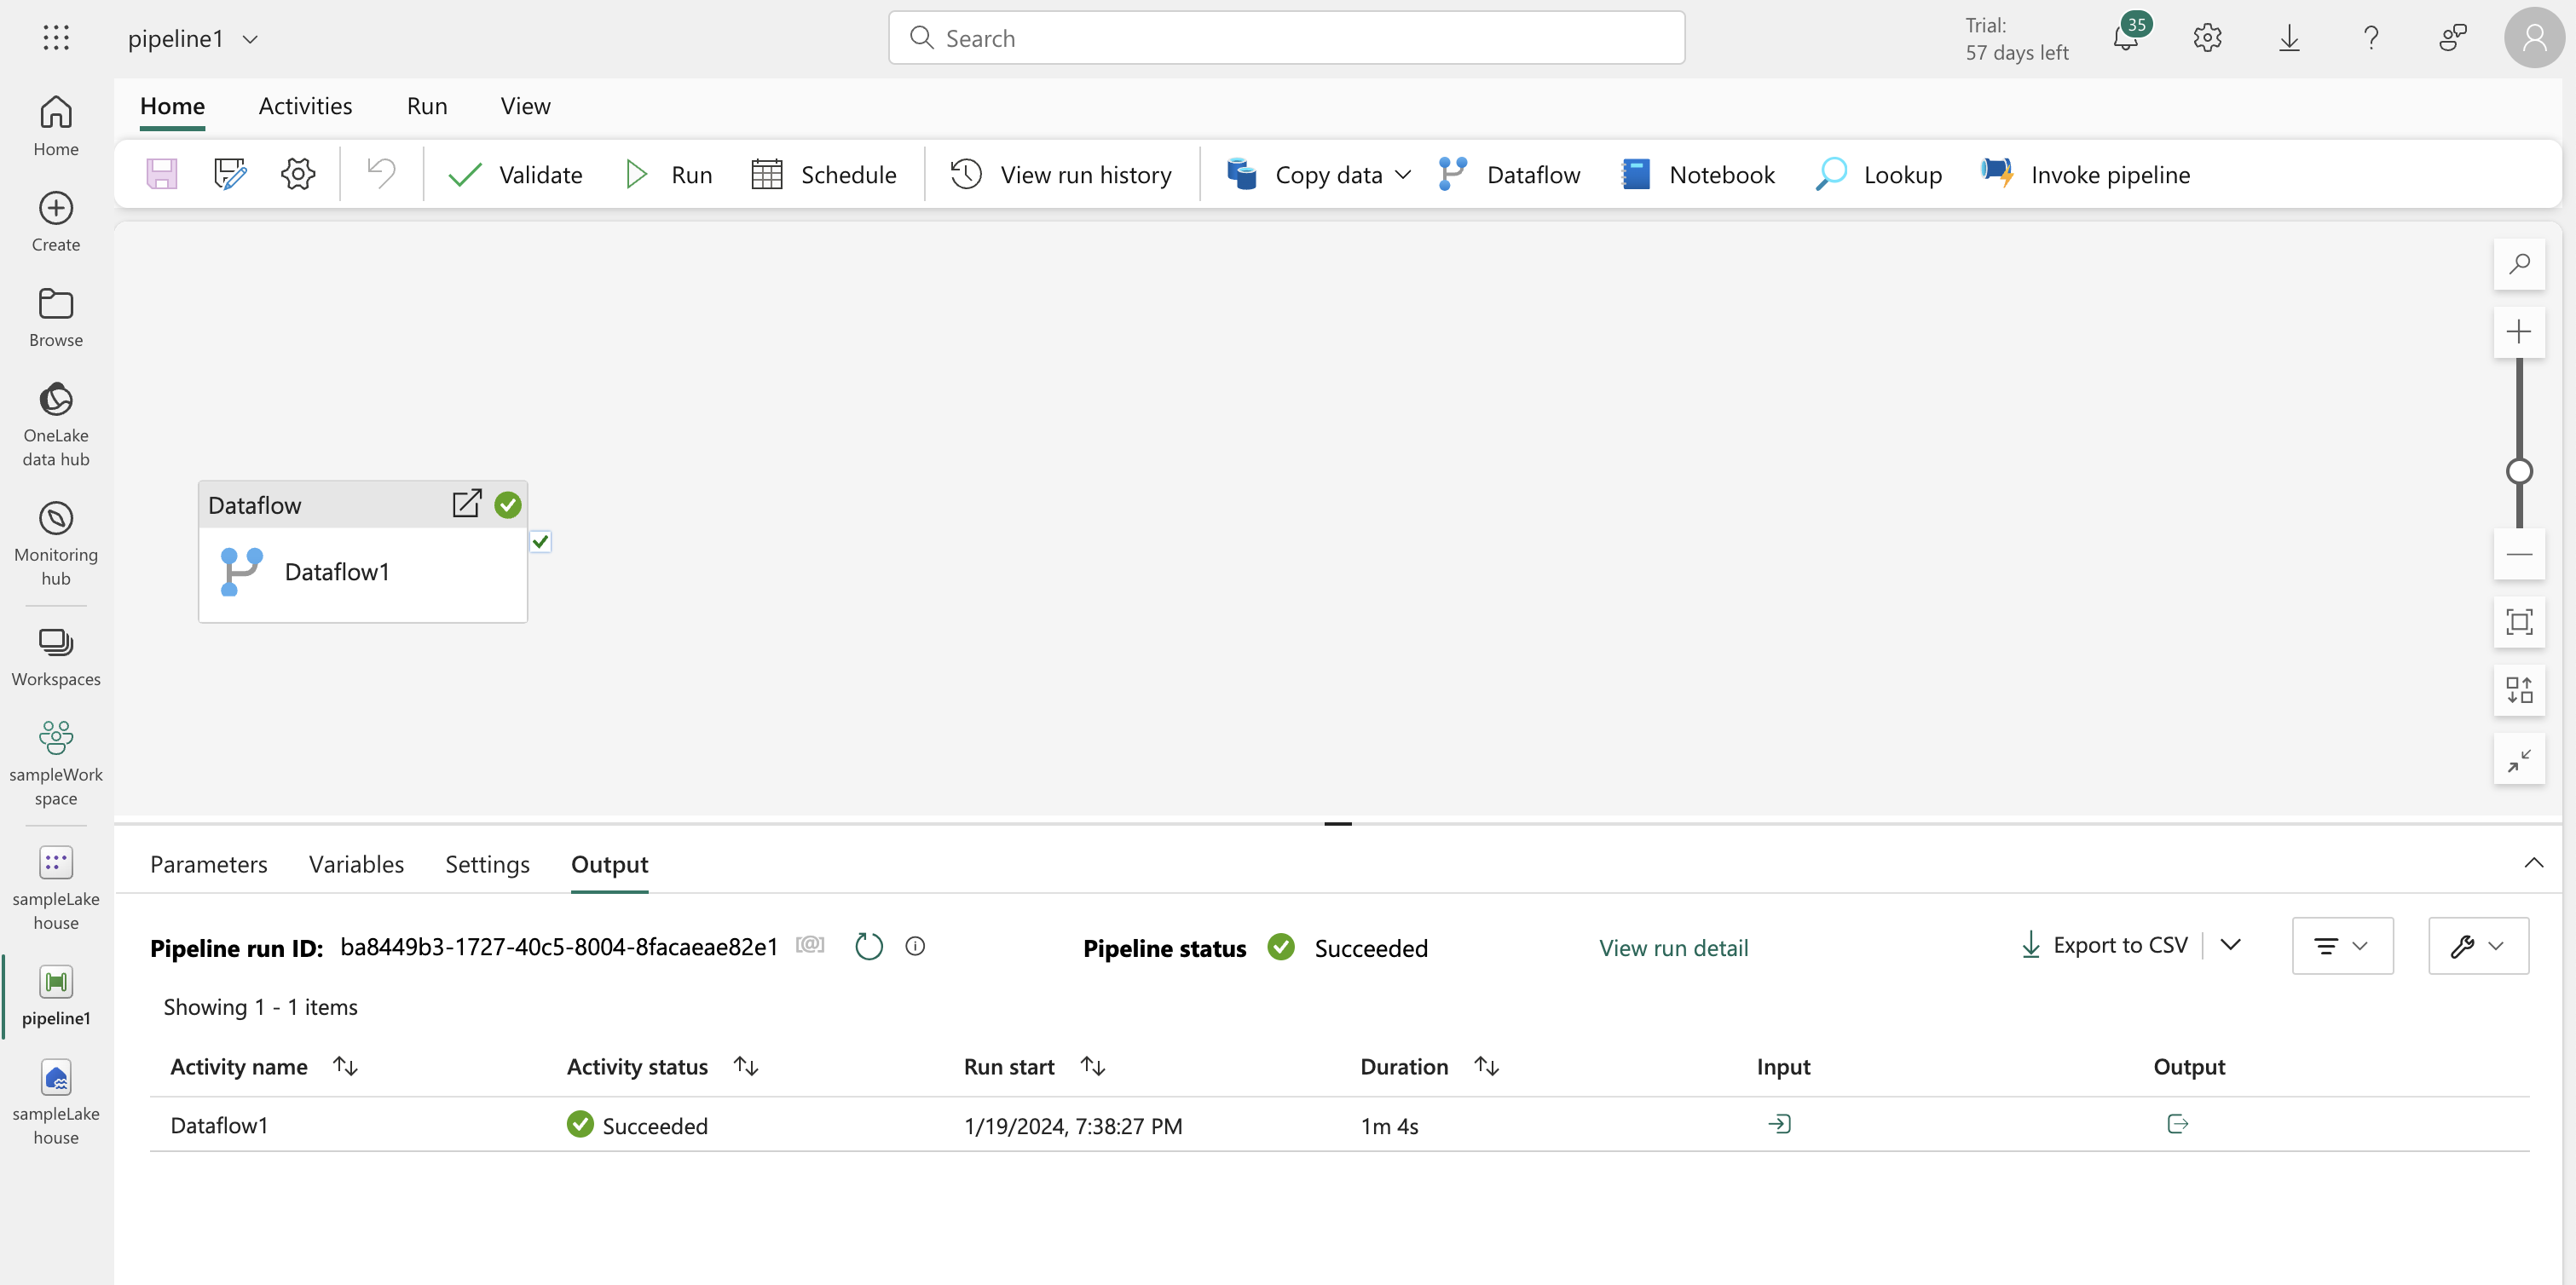
- Refresh the lakehouse to see the “orders” table created by the dataflow.
-
Additional Integration:
- Use the Power BI Desktop Dataflows connector for further data transformations and distribution.