Data Analytics
Welcome to the Microsoft PowerBI Certification Series! Discover the world of data analytics and business intelligence with our comprehensive series. Learn about Power BI, data analysis processes, roles in data management, and gain insights into using Power BI effectively.


Microsoft Data Analytics - PowerBI Series (part -1)
Introduction
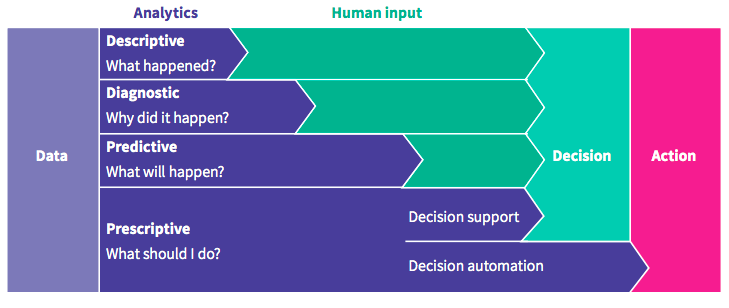
In today’s data-driven business environment, effective storytelling through data analysis is essential for both large and small companies. Data analysts play a critical role in interpreting data to inform business decisions, a process that involves understanding and leveraging various analytics categories:
-
Descriptive Analytics: Like taking a photo of what has happened. It looks at past data to tell you what occurred in your business (e.g., last year’s sales). This involves summarizing historical data to understand what has happened in the past. Techniques include generating reports on sales and financial data, and developing Key Performance Indicators (KPIs) to track objectives.
-
Diagnostic Analytics: Like being a detective. It tries to find out why something happened by looking closer at the data (e.g., why sales dropped last quarter). This type focuses on understanding why certain events occurred. It involves identifying anomalies, collecting related data, and using statistical techniques to reveal trends and relationships.
-
Predictive Analytics: Like a weather forecast. It uses past data to guess what might happen in the future (e.g., predicting next month’s sales trends). This anticipates future events by analyzing historical data for trends and patterns. Techniques include statistical and machine learning methods like neural networks, decision trees, and regression.
-
Prescriptive Analytics: Like a doctor giving advice. It suggests what you should do to reach your goals, using data to help make decisions (e.g., how to increase customer satisfaction). This form of analytics suggests actions to achieve specific goals, using insights from data to make informed decisions under uncertainty. It often relies on machine learning to identify patterns.
-
Cognitive Analytics: Like learning from experience. It tries to make smart conclusions by using data and patterns, and gets better over time (e.g., using customer feedback to improve products). These analytics draw inferences from existing data and patterns, using machine learning and natural language processing to understand unstructured data from sources like call logs and product reviews.
In practice, data analysis in businesses involves trusting the data source, capturing and shaping data into a consumable format for decision-making. As data volume increases, the demand for skilled data analysts grows. These professionals are adept at organizing, distilling, and making sense of large data sets, turning data overload into actionable insights.
Roles in Data
It’s crucial to understand the distinct roles involved in data management and analytics. Here’s a concise summary of each role:
-
Business Analyst: Interprets data from visualizations and is closely linked with the business side. They may overlap with data analysts in smaller teams.
-
Data Analyst: Key in maximizing data value via tools like Power BI. Their tasks include data profiling, cleaning, transforming, and building effective models for reports and analytics. Data analysts ensure data relevance and security, and collaborate with data engineers and database administrators for data access and process improvement.
-
Data Engineer: Specializes in setting up data platforms both on-premises and in the cloud. They manage data flow from various sources and work on integrating data services across platforms. Their role includes data ingestion, transformation, and meeting business data needs, often assisting data analysts in accessing diverse data sources.
-
Data Scientist: Focuses on advanced analytics, ranging from descriptive to predictive analytics. They engage in exploratory data analysis, machine learning, and potentially deep learning, contributing significantly to data wrangling and feature engineering.
-
Database Administrator: Manages operational aspects of database solutions, including performance, availability, backup, and recovery. They ensure database health and security, differentiating their role from data engineers who are more involved in data processing. Understanding these roles helps in efficient team collaboration and effective use of Power BI in your data projects.
Data Analysis Process

As a data analyst working with Power BI, your role is pivotal in transforming raw data into meaningful insights for business decision-making. Here’s a concise summary of the five key tasks you’ll engage in:
-
Prepare: This initial phase involves data profiling, cleaning, and transformation to ensure data integrity and usability. It’s crucial to correct inaccuracies, fill gaps, and adjust data formats. Decisions made in this stage impact data connection performance, privacy, and security.
-
Model: Once the data is primed, it’s time to model it by defining relationships between tables, adding metrics, and custom calculations. A well-designed model enhances report accuracy, facilitates efficient data exploration, and simplifies future maintenance. Poor modeling can detrimentally affect report performance, especially with large-scale data.
-
Visualize: Here, you bring data to life through reports that tell a compelling story, aiding business problem-solving. Effective visualization involves selecting appropriate graphics and interactions for clarity and efficiency. Power BI’s AI capabilities assist in creating accessible, insightful reports without coding.
-
Analyze: This step is about interpreting the information in the reports. Power BI’s analytical tools help identify patterns, predict outcomes, and communicate findings clearly. Integration with AI and machine learning enriches the analysis, allowing deeper insights and actionable objectives.
-
Manage: The final task is managing Power BI assets, including reports, dashboards, and semantic models. This involves overseeing distribution, ensuring security, and facilitating collaboration. Proper management reduces data silos, duplicates, and maintains data trustworthiness and accessibility.
Microsoft Power BI
Microsoft Power BI is a dynamic tool that brings together software services, apps, and connectors to transform diverse data sources into coherent, visually immersive, and interactive insights. It’s suitable for various data types, from simple Excel workbooks to complex hybrid data warehouses, offering ease of connection, visualization, and sharing.
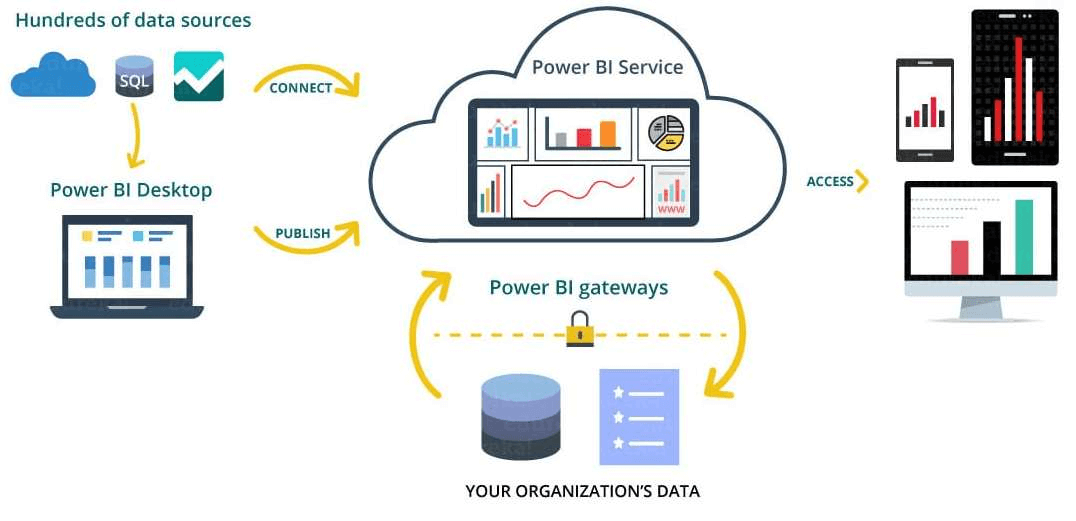
Power BI operates in three main formats:
-
Power BI Desktop: A Windows desktop application for robust data modeling and report creation.
-
Power BI Service: An online SaaS platform for sharing and consuming business insights.
-
Mobile Power BI Apps: Available for Windows, iOS, and Android, these apps allow on-the-go data access and analysis.
The versatility of Power BI caters to different roles and needs.
Getting Started
- Download Power BI Desktop from the Windows Store for automatic updates or the web for manual updates.
- Sign into Power BI Service: Requires an account, which you can set up for a free trial using your email address at app.powerbi.com.
Learning Flow
- Start by creating reports in Power BI Desktop.
- Publish these reports to the Power BI service.
- Access and drill down into these reports using Power BI Mobile apps.
Understanding Power BI Basics
-
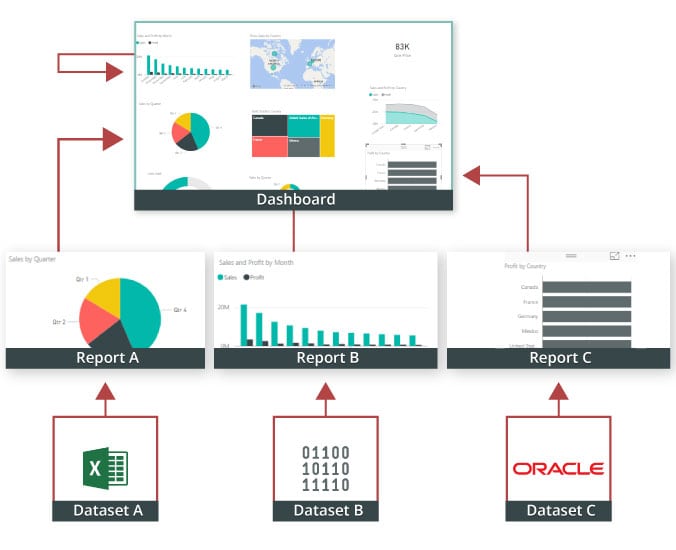
Visualizations: The visual elements like charts and maps that represent data.
-
Semantic Models: The underlying data structures, which can range from simple Excel tables to complex, multi-source models.
-
Reports: Created in Power BI Desktop, reports are collections of data visualizations.
-
Dashboards: These are single-page overviews in the Power BI service, made from report visuals.
-
Tiles: Individual visuals on a dashboard, customizable in size and layout.
Power BI combines these elements to transform data into insightful reports and dashboards, suitable for any level of complexity.
Microsoft Power BI Service
Microsoft Power BI service simplifies data analysis and sharing:
-
Create and Distribute Apps: Group and share related reports and dashboards easily.
-
Sample Reports: Use built-in samples in Power BI to learn and add reports to your workspace.
-
Report Sharing: Share reports directly with a user-friendly interface.
-
Template Apps: Explore template apps like the GitHub app for a streamlined, focused view.
-
Interactive Visuals: Interact with one part of a report to filter and update other parts.
-
Data Refreshing: Keep your data current with on-demand and scheduled refreshes, with the capability to schedule up to eight refreshes per day.
Power BI service streamlines data management and analysis, making it more accessible and efficient.